Climate Change: Science and Impacts Factsheet
Earth’s Climate
Climate change is harming health, livelihoods, infrastructure, ecosystems, and biodiversity. These impacts intensify as temperatures and sea levels rise and rainfall patterns shift, threatening housing, food and water supply, economic growth, and security.1 The acceleration of climate change observed since the industrial era is caused by greenhouse gas (GHG) emissions from human activities, with 75% of total emissions and warming occurring after 1970.1
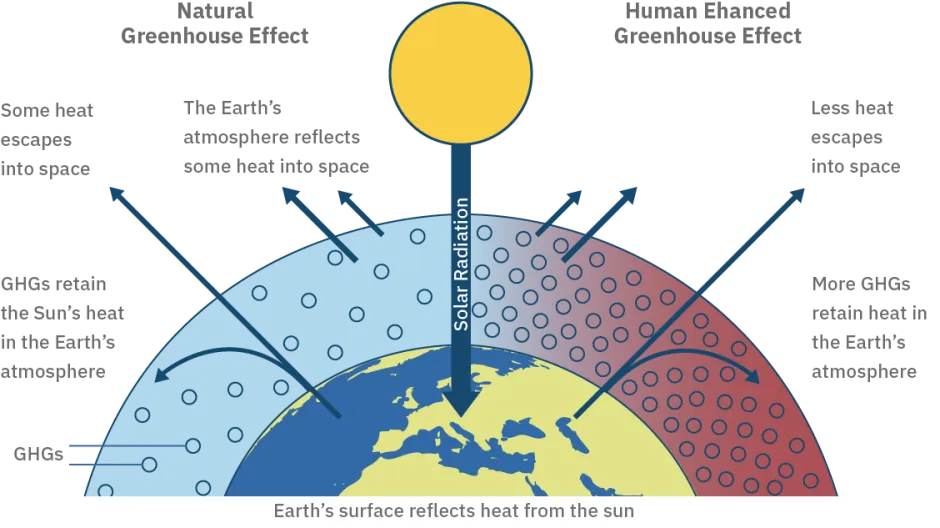
Changes in climate should not be confused with changes in weather; climate refers to long-term averages of weather patterns, while weather describes short-term conditions at a specific time and place, and exhibits a high degree of variability.2 A stable climate reflects a balance between incoming shortwave solar radiation and outgoing longwave infrared radiation.3 Solar radiation passes through the atmosphere and is mostly absorbed by Earth’s surface and re-emitted as infrared radiation.3 GHGs trap some of this, reducing the amount that escapes to space, thus warming the planet.3 See Greenhouse Gases Factsheet.
The Earth's Greenhouse Effect4
Radiative Forcing
- The natural and anthropogenic (human-caused) factors responsible for climate change are known as radiative forcers. GHGs like CO₂, CH₄, N₂O, and halocarbons are positive forcers that warm the Earth, while aerosols like SO₂ are negative forcers that cool.11
- The net impact, effective radiative forcing (ERF), is measured in watts per square meter (W/m²). Since 1750, total ERF has been positive—the largest contributor is rising CO₂ levels.11
- Natural CO₂ emissions, from volcanic activity, are 637 Mt CO₂/yr—1.6% of the 37 Gt CO₂/yr emitted by human activities.11
- Over the industrial era (1750–2019), solar irradiance has contributed an ERF of just 0.01 W/m². The anthropogenic contribution was 2.72 W/m²; GHGs had a positive forcing of 3.84 W/m², with CO₂ responsible for 56% of this total, while aerosols contributed a negative forcing of –1.1 W/m².11
- Halocarbons have global warming potential thousands of times higher than CO₂, but their ERF (0.01 W/m²) is much lower due to lower atmospheric concentrations.11
Human Influence on Climate
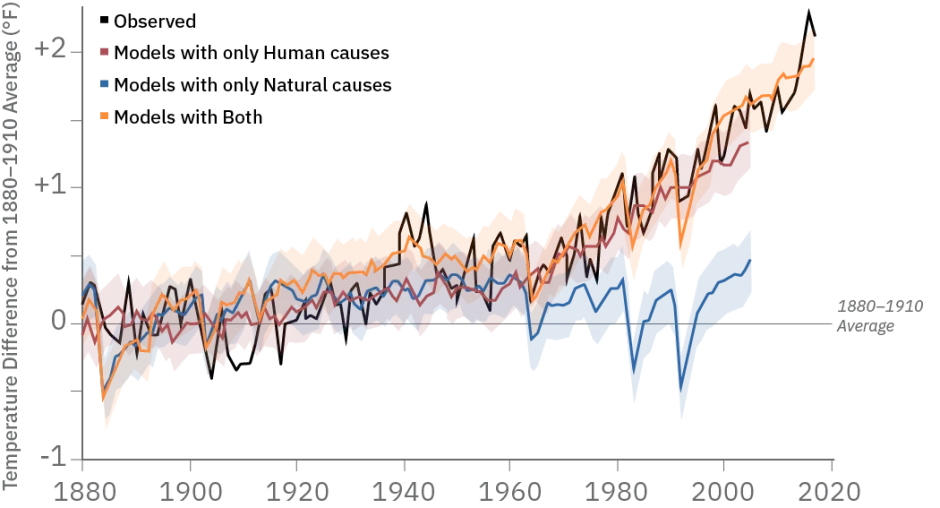
- Natural forces contributed minimally to net radiative forcing over the past century.11
- In 2023, the Intergovernmental Panel on Climate Change (IPCC) concluded that human activities—primarily GHG emissions—have unequivocally caused global warming, with global surface temperatures rising 1.1 °C (1.9 °F) above 1850–1900 levels during 2011–2020.15
Modeled and Observed Global Average Temperatures6
Climate Feedbacks and Sensitivity
- The magnitude of climate change depends on the strength of feedbacks—changes in Earth’s energy balance in response to radiative forcings.11
- This includes physical feedbacks in water vapor and temperature lapse rate; and Earth system feedbacks from biogeophysical/biogeochemical and ice sheet deterioration.11
- As the climate warms, water vapor increases, amplifying surface warming and evaporation.5
- Thawing permafrost displaces communities, disrupts ecosystems,7 and releases CO₂ and CH₄ from stores of decomposing organic matter.9 Extreme temperatures in the Artic also drive wildfires and accelerate thawing.10
- As polar ice melts, less sunlight is reflected and the oceans absorb more solar radiation.5 The ocean’s thermal inertia slows the climate’s response, creating a delayed but persistent warming effect.8
- If GHG emissions were completely eliminated today, climate change impacts would persist for centuries.11 CO₂ remains in the atmosphere for hundreds of years, impacting the climate for generations.13 The Earth’s temperature requires 25 to 50 years to reach 60% of its equilibrium response.12
Physical Systems
- 2024 was the warmest year since global records began in 1850, at 1.3 °C (2.3 °F) above the 20th century average, 0.1 °C (0.2 °F) warmer than the previous record set in 2023.17
- Global average land and ocean temperatures hit record highs in 2023.17 The 10 warmest years on record have all occurred in the past decade.17
- 2024 marked the 48th consecutive year of above-average global temperatures,17 with one of the warmest summer surface air temperatures on record.20
- Arctic sea ice is younger, thinner, and less expansive than in the 1980s and 90s.19 In 2023, North American Arctic snow cover extent set a record low.18
- Arctic sea ice cover in 2024 was the 6th lowest on record since 1979—4.34M km2. Late snow onset and early melt led to the shortest snow season in 26 years.20
- In a 4 °C warming scenario, snow cover in the Northern Hemisphere decreases further by 15%–30%.11
- The intensity and frequency of extreme precipitation events has increased, a trend that is expected to continue.21
- In the 1980s, the U.S. averaged 3.3 $1B weather disasters per year; from 2019 to 2023, the average exceeded 20 per year.22
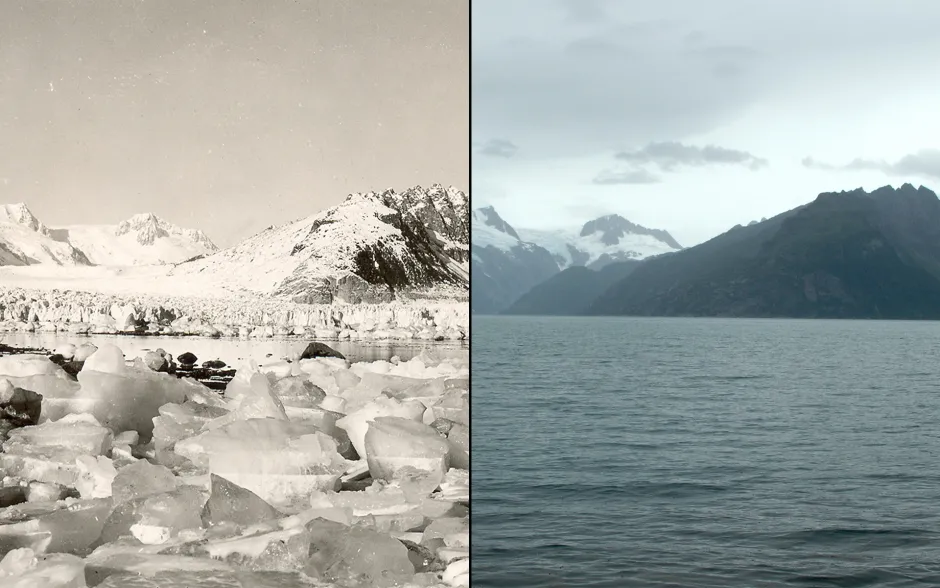
Global mean sea level has risen 15–25 cm since 1901. Due to deep ocean warming and ice sheet melting, sea level rise is unavoidable and will continue for centuries to millennia.15
Northwestern Glacier melt, Alaska, 1940-200523
Biological Systems
- Warming is altering the biological timing and geographic ranges of plants and animals.24 Approximately half of species assessed globally have shifted polewards or to higher elevations in response.15
- Often biological responses cannot adapt to the rapid spatial and temporal shifts driven by climate change.15 Ecological relationships, such as predator-prey dynamics, are disrupted when species adapt at different rates.25
- The average growing season in the contiguous U.S. increased by over two weeks since the early 20th century.26
- Increased heat stress disrupts plants’ physiological responses, reducing carbon storage. Declining precipitation amplifies drought and wildfire risks.14
Predicted Changes
Increased Temperature
- Since 1970, global average temperatures have been rising at a rate of 1.7 °C per century—far exceeding the average cooling rate of 0.01 °C per century over the past 7,000 years.27
- IPCC predicts global temperature will rise by 1.5 °C (2.7 °F) by the early 2030s.11
- Global surface temperatures are projected to rise 1.6–2.4 °C (2.9–4.3 °F) from 2041–2060, and 1.4–4.4 °C (2.5–7.9 °F) from 2081–2100, relative to 1850–1900 levels.11
Ocean Impacts
- For a 1.5 °C temperature increase by 2100, models predict sea level rise between 26–77 cm (0.9–2.5 ft), driven by thermal expansion of warming oceans, and water from melting glaciers and ice sheets.27
- Due to regional variation, a 2-ft rise in sea level would cause increases of 3.5 ft in Galveston, TX and 1 ft in Neah Bay, WA.1
- The oceans absorb about 31% of anthropogenic CO₂ emissions, resulting in increased acidity. In a 1.5 °C warming scenario, coral reefs are projected to decline by 70–90%.28,15
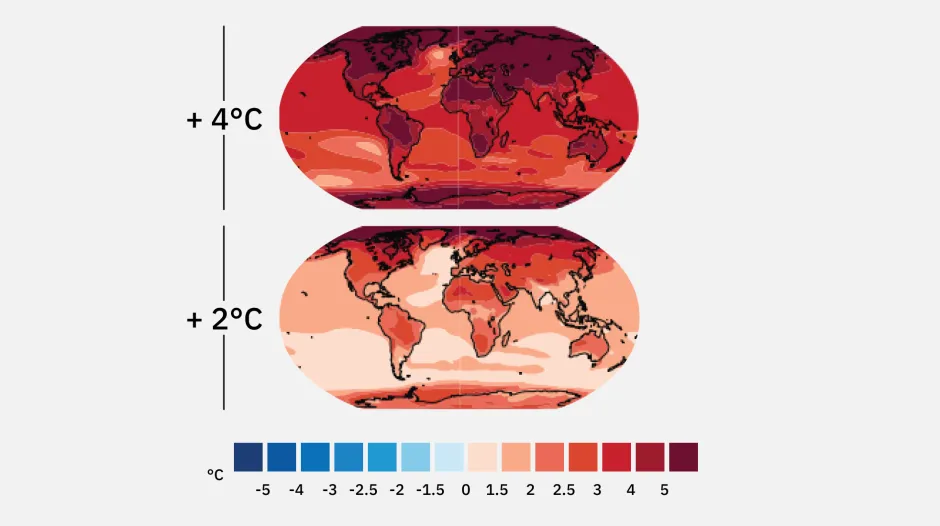
Projected Near Surface Temperature Change11
Implications for Human and Natural Systems
- The U.S. is warming faster than the global average, reflecting a pattern of faster warming over land and at higher latitudes.1
- A 4 °C warming scenario is associated with more frequent and intense hot and cold extremes, heavier precipitation events, droughts, and hurricanes.11
- In the U.S., weather disasters cost an average of $21.8B/yr in the 1980s and $33.3B/yr in the 1990s. These costs increased to $61.8B/yr in the 2000s and $98.8B/yr in the 2010s.22
- Rising temperatures, shifting precipitation patterns, and climate variability have increased the incidence of food- and water-borne illnesses. Vector-borne diseases are also occurring more often and in new geographic regions.15,29
- In 2023, the IPCC stated with very high confidence that the window of opportunity to secure a livable and sustainable future for all is closing rapidly.15
Center for Sustainable Systems, University of Michigan. 2025. "Climate Change: Science and Impacts Factsheet." Pub. No. CSS05-19.
References
1.U.S. Global Change Research Program (USGCRP) (2025) Fifth National Climate Assessment Report-in-Brief
https://www.globalchange.gov/reports/fifth-national-climate-assessment-report-brief
2.National Oceanic and Atmospheric Administration (NOAA) (2019) "What's the Difference Between Weather and Climate?"
https://www.ncei.noaa.gov/news/weather-vs-climate
3.National Aeronautics and Space Administration (2010) The Earth's Radiation Budget.
https://science.nasa.gov/ems/13_radiationbudget
4.CFR Education (2024) Understanding the Causes of Climate Change - The Greenhouse Effect
5.Intergovernmental Panel on Climate Change (IPCC) (2013) Climate Change 2013: The Physical Science Basis.
https://www.ipcc.ch/report/ar5/wg1/
6."Hayhoe, K., et al.2018: Our Changing Climate. In Impacts, Risks, and Adaptation in the United States: Fourth National Climate Assessment, Volume II [Reidmiller, D.R., C.W. Avery, D.R. Easterling, K.E. Kunkel, K.L.M. Lewis, T.K. Maycock, and B.C. Stewart (eds.)]. U.S. Global Change Research Program, Washington, DC, USA, pp. 72–144. "
https://nca2018.globalchange.gov/chapter/2/
7. United Nations. (2022). If you’re not thinking about the climate impacts of thawing permafrost, (here’s why) you should be
https://news.un.org/en/story/2022/01/1110722
8. U.S. Environmental Protection Agency (EPA) (2016) Climate Change Indicators in the U.S., 2016.
https://www.epa.gov/sites/production/files/2016-08/documents/climate_indicators_2016.pdf
9. UNEP (2012) Policy Implications of Warming Permafrost.
http://epic.awi.de/33086/1/permafrost.pdf
10. Cappucci, M. (2020) "Unprecedented heat in Siberia pushed planet to warmest June on record, tied with last year." The Washington Post.
https://www.washingtonpost.com/weather/2020/07/07/warmest-june-siberia-planet/
11. IPCC (2021) AR6 Climate Change 2021: The Physical Science Basis
https://www.ipcc.ch/report/ar6/wg1/
https://www.ipcc.ch/report/ar6/wg1/downloads/report/IPCC_AR6_WGI_FullReport_small.pdf
12. Hansen, J., et al. (2005) Earth’s Energy Imbalance: Confirmation and Implications. Science, 229(3): 857. Hansen 2005 - see Q-drive Sources file
13. Archer, D., et al. (2009) Atmospheric Lifetime of Fossil Fuel Carbon Dioxide. Annual Review of Earth and Planetary Sciences, 37: 117-34.
https://www.annualreviews.org/doi/pdf/10.1146/annurev.earth.031208.100206
14. Li Y. Climate feedback from plant physiological responses to increasing atmospheric CO2 in Earth system models. New Phytol. 2024 Dec;244(6):2176-2182. doi: 10.1111/nph.20184. Epub 2024 Oct 11. PMID: 39394759.
https://doi.org/10.1111/nph.20184
15. Intergovernmental Panel on Climate Change (IPCC) (2023) Synthesis Report of the IPCC Sixth Assessment Report (AR6) Longer report.
https://www.ipcc.ch/report/ar6/syr/
17. NOAA National Centers for Environmental Information (2025), Monthly Global Climate Report for Annual 2024, Accessed June 10, 2025
https://www.ncei.noaa.gov/access/monitoring/monthly-report/global/202413/
18. NOAA (2024) Arctic Report Card 2023.
https://arctic.noaa.gov/wp-content/uploads/2023/12/ArcticReportCard_full_report2023.pdf
19. NOAA (2022) Arctic Report Card 2022.
https://arctic.noaa.gov/Portals/7/ArcticReportCard/Documents/ArcticReportCard_full_report2021.pdf
20. NOAA (2025) Artic Report Card 2024
https://arctic.noaa.gov/report-card/report-card-2024/
21. USGCRP (2018) Fourth National Climate Assessment.
https://nca2018.globalchange.gov/downloads/NCA4_2018_FullReport.pdf
22. NOAA (2024) Billion-Dollar Weather and Climate Disasters.
23. Photo courtesy of the National Snow and Ice Data Center/World Data Center for Glaciology.
24. Secretariat of the Convention on Biological Diversity (2010) Global Biodiversity Outlook 3.
https://www.cbd.int/doc/publications/gbo/gbo3-final-en.pdf
25. National Research Council (2009) Ecological Impacts of Climate Change.
http://www.nap.edu/catalog/12491.html
26. U.S. EPA (2024) Climate Change Indicators: Length of Growing Season.
https://www.epa.gov/climate-indicators/climate-change-indicators-length-growing-season
27. IPCC (2018) Global Warming of 1.5 C: Summary for Policy Makers, Chapter 1.
28. NOAA (2019) Global Ocean Absorbing More Carbon.
https://www.ncei.noaa.gov/news/global-ocean-absorbing-more-carbon
29. National Research Council (2011) Climate Stabilization Targets: Emissions, Concentrations, and Impacts over Decades to Millennia.