U.S. Food System Factsheet
Americans enjoy a diverse abundance of low-cost food, spending just 10.6% of disposable income on food.1 However, store prices do not reflect the external economic, social, and environmental costs that affect the sustainability of the food system. Examining the full life cycle of the U.S. food system reveals the connection between consumption behaviors and production practices.
The Food System Life Cycle29
Image
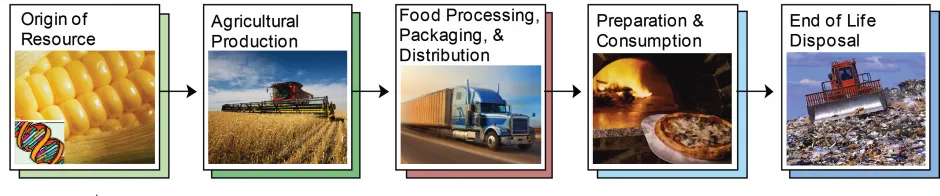
Patterns of Use
Agricultural Production
- In 2022, farmers were 1% of the U.S. population and 63% of these farmers were over the age of 55, up 2% from 2017.2,3,4
- Large-scale family farms and industrial nonfamily farms account for under 6% of farms, but over 60% of production (in $).5 Small-scale family farms represent 88% of U.S. farms, but only 18.7% of production.5
- In 2021, only 16¢ of every dollar spent on food went back to the farm, compared to 40¢ in 1975.6,7
- From 2020-2022, 42% of the hired agricultural labor force lacked authorization to work in the United States.8
- U.S. cropland declined by 14% between 1997 and 2022, from 445M to 382M acres.2
- Many agricultural regions face groundwater depletion, where water withdrawal exceeds recharge.9 In 2015, irrigation used 118B gal/day of water, 48% came from groundwater.10,11
- In 2022, irrigated farmland totaled just over 54M acres, 4M fewer than in 2017.2
- Nutrient runoff from upper Mississippi River farms contributes to a hypoxic “dead zone” in the Gulf of Mexico. In 2017, it reached 8,776 mi²—the largest since 1985.12
- From 2007 to 2012, pesticide use rose 10% while herbicide use increased 20% from 2010–2014. In 2012, U.S. agriculture used 899M lbs of pesticides;13 use is now estimated at over 1B lbs annually.50
- The share of major crops that are genetically engineered increased from 25% of corn, 61% of cotton, and 54% of soybeans in 2000 to 94%, 96%, and 96% in 2024.14
- Globally, 75B t of soil are lost to erosion on fertile lands, a financial loss of $400B per year.15
- In the U.S. Midwest alone, more than 57B tons of soil have eroded over the past 150 years,51 with future scenarios predicting an additional 8–21% increase.52
- Erosion was highest in croplands cultivated with corn, soybean, sorghum, and wheat.52
- In 2022, agriculture accounted for 10% of total U.S. greenhouse gas (GHG) emissions. The sector’s primary emissions include methane (CH₄), nitrous oxide (N₂O), and carbon dioxide (CO₂), mainly from livestock and soil management.16
Consumption Patterns
- In 2010, U.S. food supply provided 4,000 calories per person per day.17 Accounting for waste, the average American consumed 2,501 calories per day, up 22% from 1970.18
- In 2021, 185 lbs of meat per person were available for consumption, up 11.6 lbs from 1969.20 Red meat consumption declined 24% since 1970, while chicken consumption more than doubled.20 Animal feed uses 34% of grains grown.21
- Americans have access to 22.2 tsp of sweeteners per day, while the American Heart Association recommends limiting added sugars to 6–9 tsp.22,23
- Approximately 41% of U.S. adults and over 20% of 12-19 year-olds are obese (BMI > 30).24 Poor diets—especially those low in fruits and vegetables—are linked to higher risks of heart disease, certain cancers, and stroke.24,25
- 30–40% of the 2023 food supply was lost as waste, 50% more than in 1970.26,27 Food accounts for more landfill waste than any other material, making up 22% of the municipal solid waste stream in 2018, a loss of $450 and around 350 lbs of food per person annually.26,27,28 See MSW factsheet.
- Producing food that is ultimately wasted uses 2% of total U.S. annual energy use.55
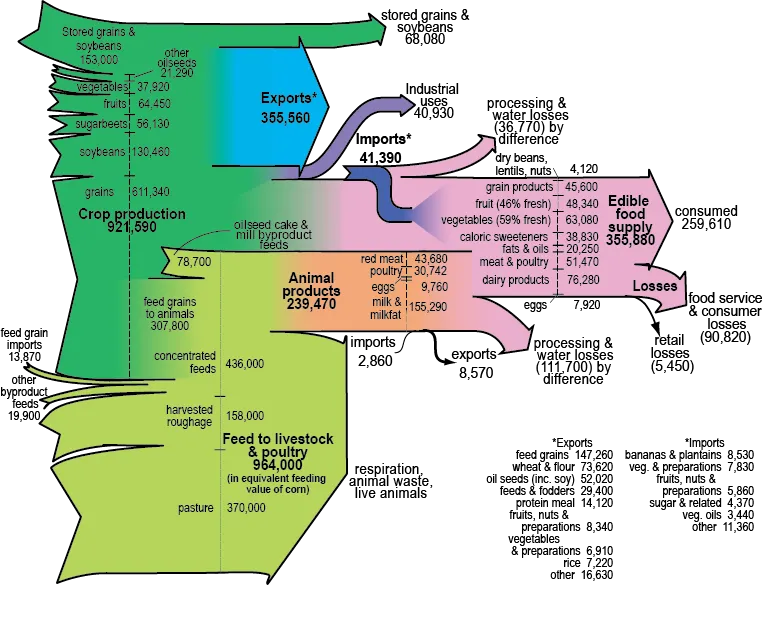
Material Flow in the U.S. Food System, 199529
Image
Life Cycle Impacts
- Food accounts for over 12% of the U.S. energy budget.30 The food system relies heavily on fossil fuels, using 13 units of (primarily) fossil energy per unit of food energy produced.19,31
- Per capita, U.S. food production generates 4.7 kg CO₂e in GHG emissions and uses 25.2 MJ of fossil fuel energy daily.32
- Reliance on fossil fuel inputs makes the food system vulnerable to oil price fluctuations.29
- Consolidation in farming, processing, and distribution has increased the distance between food sources and consumers29 and concentrated management decisions into a few hands. Four firms control 85% of the beef packing market, and four firms control 82% of soybean processing.33 The top four food retailers sold nearly 35% of U.S. food in 2019, compared to 15% in 1990.34
- Globally, 14% of food is lost between farm and retail,35 valued at $400B annually.53 Another 17% is wasted at retail and consumer levels, particularly in households.53
Energy Flow in the U.S. Food System18,19,29,31,56
Solutions and Sustainable Alternatives
Eat Less Meat
- Meat-based diets use twice as much more energy to produce as vegetarian diets.29
- Meats like beef generate 36 times more GHG per g of protein than plant-based alternatives.39
- Meat production significantly impacts land use, water use, and water pollution.37 In an average diet, meat accounts for 31% of the water scarcity footprint— the water use that accounts for regional depletion.38
- The top 20% of U.S. diets cause half of food-related GHG emissions; a shift away from meat reduces this up to 73%.32,39
- Between 2003–2018, changes in U.S. eating habits cut diet-related GHG emissions by over 35%.54
Reduce Waste
- Much household food waste is due to spoilage. To prevent this, buy smaller quantities, plan meals, stick to shopping lists, and freeze, can, or preserve excess produce.40
- Confusion over “sell-by” and “use-by” dates leads to unnecessary disposal of safe food. Consult USDA guidelines for clarity.42
- Direct-to-consumer meal services streamline supply chains, reduce last-mile transportation, and produce 25% fewer GHG emissions than store-bought meals.41
- To save water and energy while washing dishes—whether by hand or machine—avoid running water continuously, rinse with cold water, run full dishwasher loads, and skip pre-rinsing.43Food Waste Sources and Destinations44
Use Refrigeration Efficiently
Food Waste Sources and Destinations44
Image

- Home refrigeration accounts for 13% of total energy use in the U.S. food system.29 Refrigerator efficiency more than doubled from 1972 to 1990, when the first set of efficiency standards took effect, but increases in size have largely offset this improvement.29,45
- Improved refrigeration could prevent 620M tons of global food waste each year.49
- Replacing old refrigerators with Energy Star models saves 20% more energy and about $150 over the appliance’s lifetime. To further reduce waste and energy use, consider purchasing smaller quantities of fresh produce more frequently.29,46
Eat Organic
- Organic farms do not use chemicals that require large amounts of energy to produce, pollute soil and water, and cause human health impacts.
- U.S. sales of organic food in 2022 were $61.7B, 19.6% higher than in 2019; organic food now accounts for approximately 6% of all food sold in the U.S.47
Eat Local
- Transportation accounts for approximately 14% of the total energy used in the U.S. food system.48
- Buying local food and promoting farm-to-table supply chains can save large quantities of food from wasting.49
- There is much room for improvement in how people acquire their food. Community Supported Agriculture and Farmers Markets are great ways to support local food systems.
Cite As
Center for Sustainable Systems, University of Michigan. 2025. "U.S. Food System Factsheet." Pub. No. CSS01-06.
References
- U.S. Department of Agriculture (USDA), Economic Research Service (ERS) (2025) Food Expenditure Series: Normalized food expenditures by all purchasers and household final users. https://www.ers.usda.gov/data-products/food-expenditure-series/
- USDA, ERS (2024) 2022 Census of Agriculture. https://www.nass.usda.gov/Publications/AgCensus/2022/index.php
- U.S. Census Bureau (2022) “Monthly Population Estimates for the U.S." https://www.census.gov/newsroom/press-releases/2022/2022-population-estimates.html
- USDA, ERS (2019) 2017 Census of Agriculture. https://www.nass.usda.gov/AgCensus/
- USDA (2023) America's Diverse Family Farms. https://www.ers.usda.gov/publications/pub-details/?pubid=105387#:~:text=The%20America%27s%20Farms%20and%20Ranches%20at%20a%20Glance,and%20farm%20household%20financial%20characteristics%20by%20farm%20size.
- USDA, ERS (2025) Food Dollar Series. https://data.ers.usda.gov/reports.aspx?ID=4045
- Elitzak, H. (1999) Food Cost Review, 1950-97. USDA, Agricultural Economic Report 780. http://ageconsearch.umn.edu/record/34053/files/ae990780.pdf
- USDA, ERS (2025) Farm Labor. https://www.ers.usda.gov/topics/farm-economy/farm-labor/
- Konikow, L. (2013) Groundwater depletion in the United States (1900-2008). U.S. Geological Survey (USGS) Scientific Investigations Report. http://pubs.usgs.gov/sir/2013/5079/
- USGS (2019) "Irrigation Water Use." https://www.usgs.gov/mission-areas/water-resources/science/irrigation-water-use?qt-science_center_objects=0#qt-science_center_objects
- USGS (2015) Water Use Data - Irrigation https://waterdata.usgs.gov/nwis/water_use?wu_year=ALL&wu_category=I&submitted_form=introduction&wu_category_nms=Irrigation%2C+in+Bgal%2Fd
- National Oceanic and Atmospheric Administration (NOAA) (2017) "Gulf of Mexico 'Dead Zone' is the Largest ever Measured." http://www.noaa.gov/media-release/gulf-of-mexico-dead-zone-is-largest-ever-measured
- USDA, ERS (2019) Agricultural Resources and Environmental Indicators, 2019. https://www.ers.usda.gov/publications/pub-details?pubid=93025
- USDA, ERS (2025) “Adoption of Genetically Engineered Crops in the U.S.” https://www.ers.usda.gov/data-products/adoption-of-genetically-engineered-crops-in-the-u-s/
- Borrelli, P., et al. (2017) “An assessment of the global impact of 21st century land use change on soil erosion.” Nature Communications, 8(1). https://www.ncbi.nlm.nih.gov/pmc/articles/PMC5722879/
- U.S. Environmental Protection Agency (EPA) (2024) Inventory of U.S. Greenhouse Gas Emissions and Sinks 1990 - 2022. https://www.epa.gov/ghgemissions/inventory-us-greenhouse-gas-emissions-and-sinks-1990-2022
- USDA, ERS (2015) “Archived Tables - Nutrient Availability.” https://www.ers.usda.gov/data-products/food-availability-per-capita-data-system/
- USDA, ERS (2019) "Loss-Adjusted Food Availability - Calories." https://www.ers.usda.gov/data-products/food-availability-per-capita-data-system/
- USDA, ERS (2022) "Food Availability." https://www.ers.usda.gov/data-products/food-availability-per-capita-data-system/
- USDA, ERS (2025) Feed Grains Yearbook Tables. https://www.ers.usda.gov/data-products/feed-grains-database/feed-grains-yearbook-tables/
- USDA, ERS (2022) "Loss-Adjusted Food Availability - Sugar and sweeteners (added)." https://www.ers.usda.gov/data-products/food-availability-per-capita-data-system/
- American Heart Association (2019) Added Sugar Is Not So Sweet - Infographic. https://www.heart.org/en/healthy-living/healthy-eating/eat-smart/sugar/added-sugar-is-not-so-sweet-infographic
- U.S. Department of Health and Human Services (2021) “Health, United States, 2019.” https://www.cdc.gov/nchs/hus/index.htm
- Harvard T.H. Chan, School of Public Health (2016) "What Should I Eat: Vegetables and Fruits." https://www.hsph.harvard.edu/nutritionsource/what-should-you-eat/vegetables-and-fruits/
- U.S. EPA (2023) "U.S. 2030 Food Loss and Waste Reduction Goal." https://www.epa.gov/sustainable-management-food/united-states-2030-food-loss-and-waste-reduction-goal
- Natural Resource Defense Council (2017) "Wasted: How America Is Losing Up to 40 Percent of Its Food from Farm to Fork to Landfill." https://www.nrdc.org/sites/default/files/wasted-2017-report.pdf
- U.S. EPA (2020) Advancing Sustainable Materials Management: 2018 Tables and Figures. https://www.epa.gov/facts-and-figures-about-materials-waste-and-recycling/advancing-sustainable-materials-management
- Heller, M. and G. Keoleian (2000) Life Cycle-Based Sustainability Indicators for Assessment of the U.S. Food System, The University of Michigan - Center for Sustainable Systems, Ann Arbor, MI, 1-60, CSS00-04 http://css.snre.umich.edu/publication/assessing-sustainability-us-food-system-life-cycle-perspective
- USDA, ERS (2017) The Role of Fossil Fuels in the U.S. Food System and the American Diet. https://ers.usda.gov/sites/default/files/_laserfiche/publications/82194/ERR-224.pdf?v=83242
- Canning, P., et al. (2010) Energy Use in the U.S. Food System. USDA, ERS. https://www.ers.usda.gov/webdocs/publications/46375/8144_err94_1_.pdf?v=0
- Heller, M., et al. (2018) "Greenhouse gas emissions and energy use associated with production of individual self-selected U.S. diets." Environmental Research Letters 13(4):1-11. https://iopscience.iop.org/article/10.1088/1748-9326/aab0ac
- USDA, ERS (2016) Thinning Markets in U.S. Agriculture. https://ers.usda.gov/sites/default/files/_laserfiche/publications/44034/56926_eib148.pdf?v=95552
- USDA, ERS (2021) "Retail Trends." https://www.ers.usda.gov/topics/food-markets-prices/retailing-wholesaling/retail-trends/
- FAO (2019) The State of Food and Agriculture https://www.fao.org/3/ca6030en/ca6030en.pdf
- U.S. EPA (2021) “Agricultural Animal Production.” https://www.epa.gov/agriculture/agricultural-animal-production
- Heller, M., et al. (2021) “Individual U.S. diets show wide variation in water scarcity footprints.” https://www.nature.com/articles/s43016-021-00256-2.epdf?sharing_token=KQnBLAZ3tc0UHdSA-gQCVNRgN0jAjWel9jnR3ZoTv0OQ9qEx2hhpOzV_XxWTVeccP7An3vuX5NTvP_GAK5vN70SE5HnCMpZ1hlE_qpTko-SFHUqimdLK9cil8HANgmQ4aBazWgq9OvXbiv8EzDlJPoxGFJKKtJyOK0t21d8Zye4%3D
- Poore, J. and T. Nemecek (2019) "Reducing food's environmental impacts through producers and consumers." Science, 360(6392), 987-992. https://doi.org/10.1126/science.aaq0216
- U.S. EPA (2021) “Reducing Wasted Food at Home.” https://www.epa.gov/recycle/reducing-wasted-food-home
- Heard, B. R., Bandekar, M., Vassar, B., & Miller, S. A. (2019). “Comparison of life cycle environmental impacts from meal kits and grocery store meals.” Resources, Conservation and Recycling, 147, 189–200 https://css.umich.edu/publications/research-publications/comparison-life-cycle-environmental-impacts-meal-kits-and
- USDA, ERS (2019) "Food Product Dating." https://www.fsis.usda.gov/wps/portal/fsis/topics/food-safety-education/get-answers/food-safety-fact-sheets/food-labeling/food-product-dating/food-product-dating
- Porras, G., et al. (2020) A guide to household manual and machine dishwashing through a life cycle perspective. Environmental Research Communications, 2(2020). https://iopscience.iop.org/article/10.1088/2515-7620/ab716b/pdf
- EPA (2023) 2019 Wasted Food Report https://www.epa.gov/system/files/documents/2023-03/2019%20Wasted%20Food%20Report_508_opt_ec.pdf
- Cornell Cooperative Extension (2003) "Replace Your Old Refrigerator and Cut Your Utility Bill." http://chemung.cce.cornell.edu/resources/replace-your-older-refrigerator-to-reduce-energy-costs
- Energy Star (2025) Refrigerators. https://www.energystar.gov/products/refrigerators
- Organic Trade Association (2023) "Organic food sales break through $60 billion in 2022." https://ota.com/news/press-releases/21755
- State of Oregon Department of Environmental Quality (2017) "Food Transportation." https://www.oregon.gov/deq/FilterDocs/PEF-FoodTransportation-FullReport.pdf
- Friedman-Heiman, A. and Miller, S.A. (2024) "The impact of refrigeration on food losses and associated greenhouse gas emissions throughout the supply chain" Environmental Research Letters, 19: 064038. https://iopscience.iop.org/article/10.1088/1748-9326/ad4c7b
- USGS (2017) Pesticides By Ohio-Kentucky-Indiana Water Science Center https://www.usgs.gov/centers/ohio-kentucky-indiana-water-science-center/science/pesticides#overview
- Thaler et al (2022) Rates of Historical Anthropogenic Soil Erosion in the Midwestern United States https://agupubs.onlinelibrary.wiley.com/doi/10.1029/2021EF002396
- Shojaeezadeh et al. (2024) Soil erosion in the United States Present and Future (2020-2050) https://doi.org/10.1016/j.catena.2024.108074
- FAO (2022) Tackling food loss and waste https://www.fao.org/newsroom/detail/FAO-UNEP-agriculture-environment-food-loss-waste-day-2022/en
- Bassi C., et al, (2022) Declining greenhouse gas emissions in the US diet (2003–2018) https://www.sciencedirect.com/science/article/pii/S0959652622010861
- Cuellar, A. and M. Webber (2010) "Wasted food, wasted energy: The embedded energy in food waste in the United States." Environmental Science & Technology, 44(16): 6464-69.
https://pubs.acs.org/doi/full/10.1021/es100310d - U.S. Census Bureau (2002) National Population Estimates.