Climate Change: Science and Impacts Factsheet

The Earth’s Climate
Climate change is altering temperature, precipitation, and sea levels, and will adversely impact human and natural systems, including water resources, human settlements and health, ecosystems, and biodiversity. The unprecedented acceleration of climate change over the last 50 years and the increasing confidence in global climate models add to the compelling evidence that climate is being affected by greenhouse gas (GHG) emissions from human activities.2
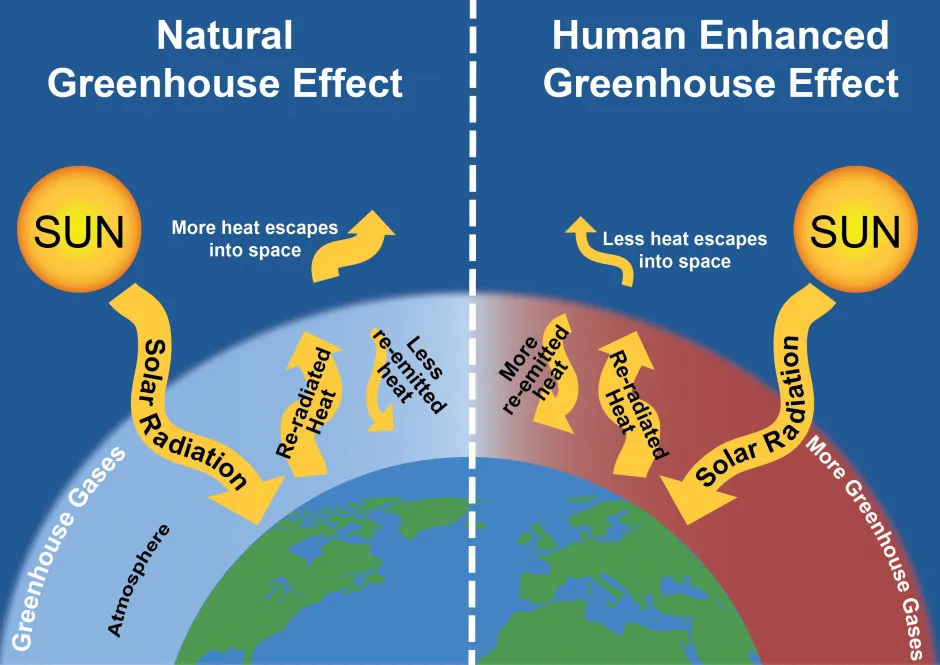
Changes in climate should not be confused with changes in weather. Weather is observed at a particular location on a time scale of hours or days, and exhibits a high degree of variability, whereas climate is the long-term average of short-term weather patterns, such as the annual average temperature or rainfall.3 Under a stable climate, there is an energy balance between incoming short wave solar radiation and outgoing long wave infrared radiation. Solar radiation passes through the atmosphere and most is absorbed by the Earth’s surface. The surface then re-emits energy as infrared radiation, a portion of which escapes into space. Increases in the concentrations of greenhouse gases in the atmosphere reduce the amount of energy the Earth’s surface radiates to space, thus warming the planet.4
The Earth's Greenhouse Effect1
Climate Forcings
- Disturbances of the Earth’s balance of incoming and outgoing energy are referred to as positive or negative climate forcings. Positive forcings, such as GHGs, exert a warming influence on the Earth, while negative forcings, such as sulfate aerosols, exert a cooling influence.5
- Increased concentrations of GHGs from anthropogenic sources have increased the absorption of infrared radiation, enhancing the natural greenhouse effect. Methane and other GHGs are more potent, but CO₂ contributes most to warming because of its prevalence.5
- Anthropogenic GHG emissions, to date, amount to a climate forcing roughly equal to 1% of the net incoming solar energy, or the energy equivalent of burning 13 million barrels of oil every minute.6
Climate Feedbacks and Inertia
- •Climate change is also affected by the Earth’s responses to forcings, known as climate feedbacks. For example, the increase in water vapor that occurs with warming further increases surface warming and evaporation, as water vapor is a powerful GHG.5
- The volume of the ocean results in large thermal inertia that slows the response of climate change to forcings; energy balance changes result in delayed climate response with high momentum.7
- As polar ice melts, less sunlight is reflected and the oceans absorb more solar radiation.5
- Due to increasing temperature, large reserves of organic matter frozen in subarctic permafrost will thaw and decay, releasing additional CO₂ and methane to the atmosphere.8 June 2020 was tied for the warmest on record and extreme temperatures in the Artic (especially Siberia) contributed to large wildfires and further thawing of permafrost. The fires alone were estimated to have released 59 million metric tons (Mt) of CO₂ into the atmosphere.9
- If GHG emissions were completely eliminated today, climate change impacts would still continue for centuries.10 The Earth’s temperature requires 25 to 50 years to reach 60% of its equilibrium response.11
- Today’s emissions will affect future generations; CO₂ persists in the atmosphere for hundreds of years.12
Human Influence on Climate
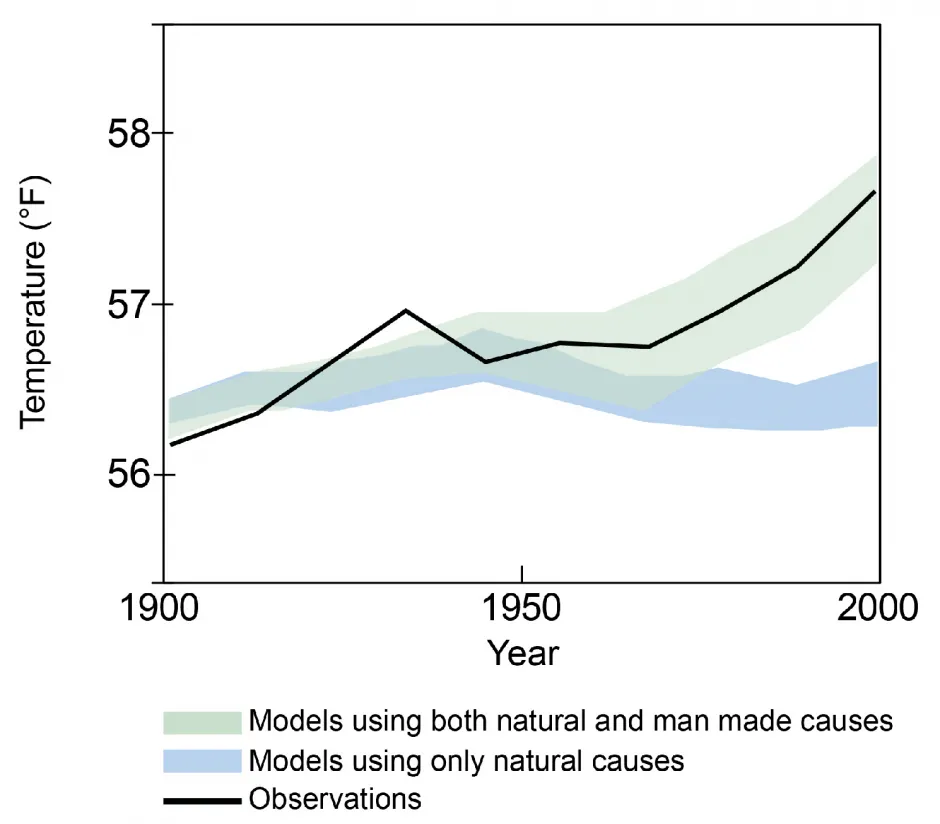
- Separately, neither natural forcings (e.g., volcanic activity and solar variation) nor anthropogenic forcings (e.g., GHGs and aerosols) can fully explain the warming experienced since 1850.13
- Climate models most closely match the observed temperature trend only when natural and anthropogenic forcings are considered together.13
- In 2023, the Intergovernmental Panel on Climate Change (IPCC) concluded that: “human activities, principally through emissions of greenhouse gases, have unequivocally caused global warming, with global surface temperature reaching 1.1°C above 1850-1900 in 2011-2020.”14
Modeled and Observed Global Average Temperatures14
Observed Impacts
Physical Systems
- Global average temperatures in 2022 were 0.86°C (1.55°F) higher than the 20th century average.16
- The warmest year on record since records began in 1880 was 2016, with 2020 ranking second. In 2020 global average land temperatures experienced a record high, while 2016 global ocean temperatures remain the highest on record.17 The nine warmest years on record since 1880 have all occurred within the last nine years (2014-2022), and in 2022 annual global temperatures were above average for the 46th consecutive year.16
- Annual 2022 arctic temperatures rose to 0.73°C above the 1991-2020 average. Arctic sea ice is younger, thinner, and less expansive than in the 1980s and 90s.18 The 2021 extent of ice reached the twelfth lowest annual cover on record since 1979, 4.92 million square kilometers.19
- U.S. average annual precipitation has increased by 4% since 1901, but the intensity and frequency of extreme precipitation events has increased even more, a trend that is expected to continue.20
- Global mean sea level has rose between 15 and 25 cm since 1901. Due to deep ocean warming and ice sheet melt, sea level rise is unavoidable and will continue for centuries to millennia.14
- Snow cover has noticeably decreased in the Northern Hemisphere. Current temperatures have risen 1.1°C and snow cover has decreased 1% relative to 1850-1900. Under a 4°C warming scenario, snow cover is predicted to decrease by 15%-30%.10
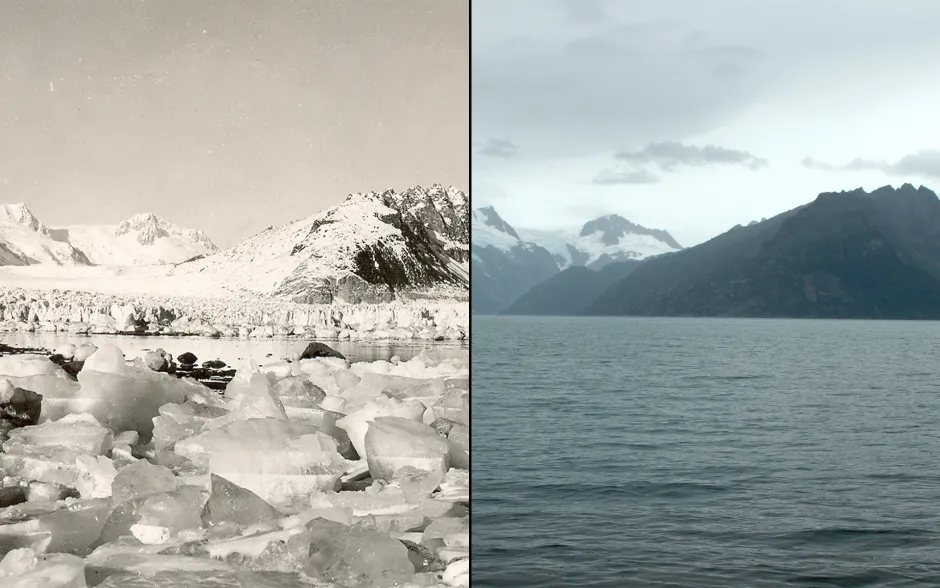
Northwestern Glacier melt, Alaska, 1940-200518
Biological Systems
- Warming that has already occurred is affecting the biological timing (phenology) and geographic range of plant and animal communities.22
- Often biological responses are not sufficient to handle the rapid spatial and temporal shifts that climate change is causing. Globally, approximately half of the species assessed have shifted polewards or to higher elevations.14
- Relationships such as predator-prey interactions are affected by these shifts, especially when changes occur unevenly between species.23
- Since the start of the 20th century, the average growing season in the contiguous 48 states has lengthened by nearly two weeks.24
Predicted Changes
Increased Temperature
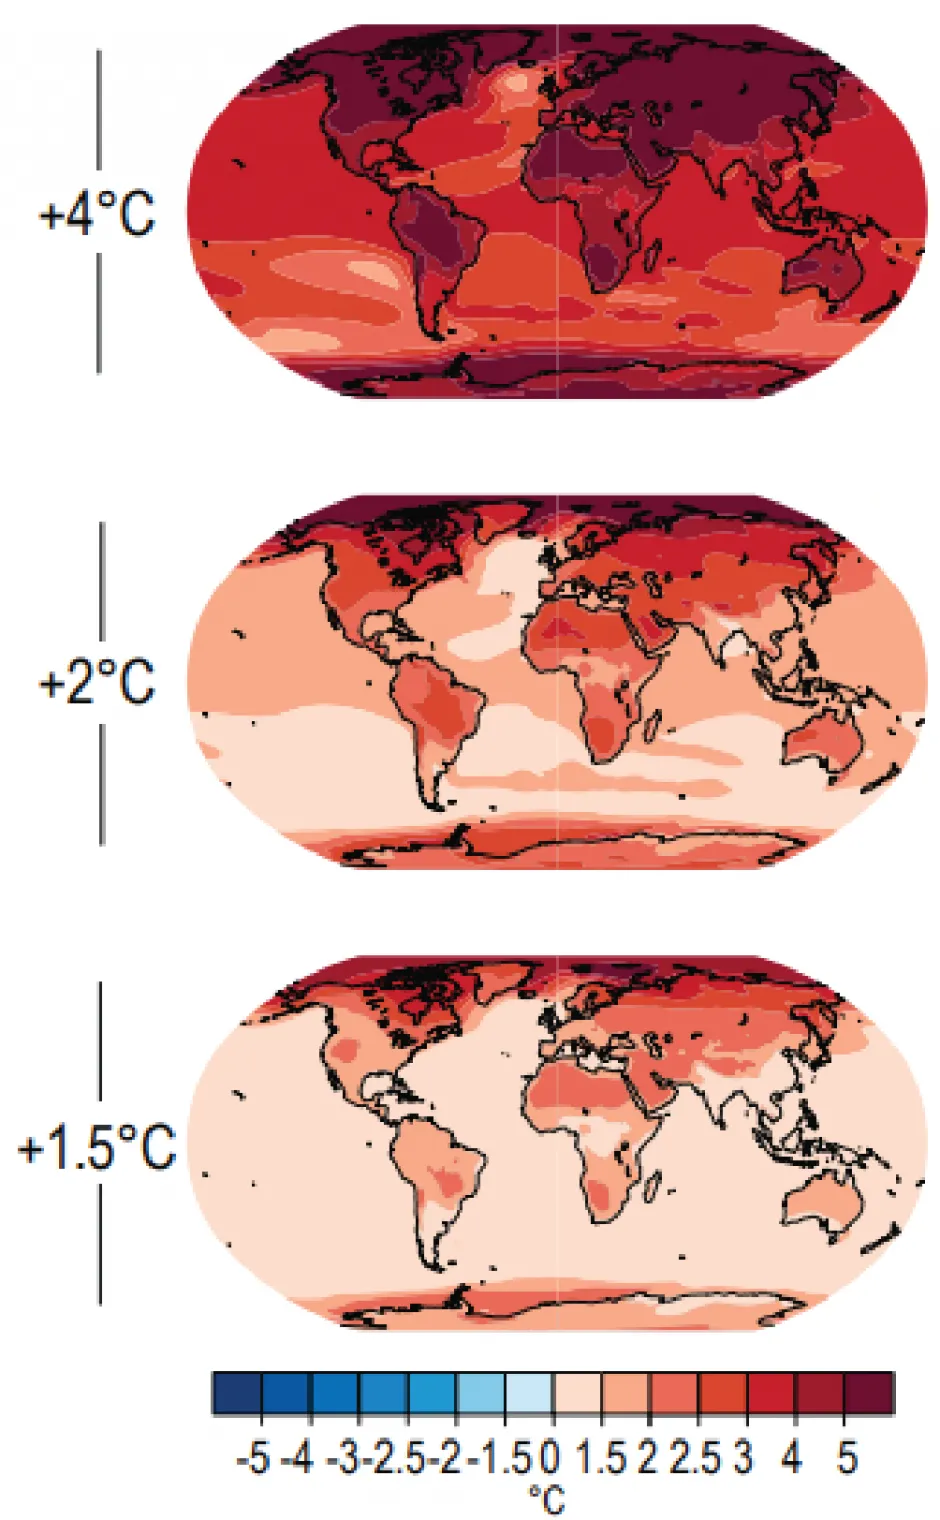
- IPCC predicts global temperature will rise by 1.5°C (2.7°F) by the early 2030s.10 In the long term, global mean surface temperatures are predicted to rise 0.4-2.6°C (0.7-4.7°F) from 2045-2065 and 0.3-4.8°C (0.5-8.6°F) from 2081- 2100, relative to the reference period of 1986-2005. Since 1970, global average temperatures have been rising at a rate of 1.7°C per century, significantly higher than the average rate of decline of 0.01°C over the past 7,000 years.5,25
Projected Near Surface Temperature Change Based on Warming Scenarios10
Ocean Impacts
- Models anticipate sea level rise between 26 and 77 cm for a 1.5°C increase in temperature by 2100. The rise is a result of thermal expansion from warming oceans and water added to the oceans by melting glaciers and ice sheets.25
- The oceans absorb about 31% of anthropogenic CO2 emissions, resulting in increased acidity. Coral reefs are projected to decline by 70–90% under a 1.5°C global warming senario.14,26
Implications for Human and Natural Systems
- This century, an unprecedented combination of climate change, associated disturbances, and other global change drivers will likely exceed many ecosystems’ capacities for resilience.27 Risks associated with a warming scenario of 4°C include more frequent and intense hot and cold extreme temperatures, precipitation events, droughts, and hurricanes.10
- In 2023, the IPCC stated with very high confidence that “There is a rapidly closing window of opportunity to secure a livable and sustainable future for all.”14
- With an increase in average global temperatures of 2°C, nearly every summer would be warmer than the hottest 5% of recent summers.28
- Increased temperatures, changes in precipitation, and climate variability have increased the occurrence of food-borne and water-borne diseases. Vector-borne diseases are also occurring more often and in new geographic regions.14,28
- Although higher CO₂ concentrations and slight temperature increases can boost crop yields, the negative effects of warming on plant health and soil moisture lead to lower yields at higher temperatures. Intensified soil and water resource degradation resulting from changes in temperature and precipitation will further stress agriculture in certain regions.28
Center for Sustainable Systems, University of Michigan. 2023. "Climate Change: Science and Impacts Factsheet." Pub. No. CSS05-19.
References
- Adapted from image by W. Elder, National Park Service.
- U.S. Global Change Research Program (USGCRP) (2009) Global Climate Change Impacts in the U.S.
- National Oceanic and Atmospheric Administration (NOAA) (2019) “What’s the Difference Between Weather and Climate?”
- National Aeronautics and Space Administration (2010) The Earth’s Radiation Budget.
- Intergovernmental Panel on Climate Change (IPCC) (2013) Climate Change 2013: The Physical Science Basis.
- CSS calculation based on data from UN Environment Programme (UNEP) and UN Framework Convention on Climate Change (UNFCCC) (2003) Climate Change Information Kit.
- U.S. Environmental Protection Agency (EPA) (2016) Climate Change Indicators in the U.S., 2016.
- UNEP (2012) Policy Implications of Warming Permafrost.
- Cappucci, M. (2020) “Unprecedented heat in Siberia pushed planet to warmest June on record, tied with last year.” The Washington Post.
- IPCC (2021) AR6 Climate Change 2021: The Physical Science Basis
- Hansen, J., et al. (2005) Earth’s Energy Imbalance: Confirmation and Implications. Science, 229(3): 857.
- Archer, D., et al. (2009) Atmospheric Lifetime of Fossil Fuel Carbon Dioxide. Annual Review of Earth and Planetary Sciences, 37: 117-34.
- UNEP and GRID-Arendal (2005) Vital Climate Change Graphics.
- Intergovernmental Panel on Climate Change (IPCC) (2023) Synthesis Report of the IPCC Sixth Assessment Report (AR6) Longer report.
- Adapted from USGCRP (2009) Global Climate Change Impacts in the United States.
- NOAA (2023) State of the Climate: 2022 Global Climate Report.
- NOAA (2022) State of the Climate: 2021 Global Climate Report.
- NOAA (2022) Arctic Report Card 2022.
- NOAA (2021) Arctic Report Card 2021.
- USGCRP (2018) Fourth National Climate Assessment.
- Photo courtesy of the National Snow and Ice Data Center/World Data Center for Glaciology.
- Secretariat of the Convention on Biological Diversity (2010) Global Biodiversity Outlook 3.
- National Research Council (2009) Ecological Impacts of Climate Change.
- U.S. EPA (2021) Climate Change Indicators: Length of Growing Season.
- IPCC (2018) Global Warming of 1.5 C: Summary for Policy Makers, Chapter 1.
- NOAA (2019) Global Ocean Absorbing More Carbon.
- IPCC (2007) Climate Change 2007: Impacts, Adaptation and Vulnerability. Working Group II Contributions to the IPCC Fourth Assessment Report.
- National Research Council (2011) Climate Stabilization Targets: Emissions, Concentrations, and Impacts over Decades to Millennia.