Greenhouse Gases Factsheet

The Greenhouse Effect
The greenhouse effect is a natural phenomenon that insulates the Earth from the cold of space. As solar radiation reaches the Earth, it is absorbed and re-emitted as infrared energy. Greenhouse gases (GHGs) in the atmosphere prevent some of this heat from escaping into space, instead reflecting the energy back to further warm the surface.1 The greenhouse effect was first described in the 1820s. By the late 1800s, scientists had identified specific GHGs and human activities, such as burning coal, that intensify this.2 Anthropogenic (human-caused) GHG emissions are changing the Earth’s energy balance between incoming solar radiation and outgoing heat, amplifying the greenhouse effect and resulting in climate change.1
Greenhouse Gases
- Of the primary GHGs, water vapor (H₂O), carbon dioxide (CO₂), methane (CH₄), and nitrous oxide (N₂O) can occur naturally. F-gases—hydrofluorocarbons (HFCs), chlorofluorocarbons (CFCs), perfluorocarbons (PFCs), and sulfur hexafluoride (SF₆)—arise exclusively from industrial processes.1
- Water vapor is the most abundant GHG in the atmosphere. Its concentration is regulated by temperature and other meteorological factors, rather than direct human activities.1
- Global Warming Potentials (GWPs) measure the relative effectiveness of GHGs in trapping heat in the atmosphere over a given period. CO₂, the dominant anthropogenic GHG, serves as the reference with a GWP of 1. N₂O has a 100-year GWP of 273, meaning it traps 273 times more heat than the same amount of CO₂ over the same time period.1
- GHG emissions are reported in terms of carbon dioxide equivalents (CO₂e), calculated by multiplying the mass of each gas by its GWP.5
- In addition to trapping heat, ozone-depleting GHGs such as CFCs damage O₃ in the stratosphere, reducing its ability to block ultraviolet radiation.1
The Main Greenhouse Gases1,3
Atmospheric Concentrations
- Since 1750, atmospheric concentrations of CO₂, CH₄, and N₂O have risen by 51%, 165%, and 25%, respectively,3 to levels unprecedented in the past 800,000 years.1
- Before the Industrial Revolution, CO₂ levels remained about 290 parts per million (ppm).1 By February 2025, the global monthly average concentration had increased to 426 ppm.6
Sources of Greenhouse Gas Emissions
- Fossil fuel combustion is the primary anthropogenic source of CO₂, which is also released through land-use changes such as deforestation, land clearing, and soil degradation.26
- CH₄ arises from agricultural activities, waste management, energy production and use, and biomass burning.26
- Anthropogenic N₂O emissions mostly come from agricultural activities, like fertilizer use, as well as chemical production and fossil fuel combustion.26
- Industrial processes, refrigeration, and consumer products lead to emissions of HFCs (substitutes for O₃-depleting CFCs),PFCs, and SF₆.7,26
Emissions and Trends
Global
- In 2023, global anthropogenic GHG emissions totaled 52.9 Gt CO₂e, a 62% increase since 1990.8
- Average annual GHG emissions were 56 Gt CO₂e from 2010–2019—a record high, and 10 Gt CO₂e more than 2000–2009.4
- CO₂ from fossil fuel combustion accounts for 64% of global anthropogenic GHG emissions.4 In 2024, global energy-related CO₂ emissions reached a record high of 37.8 Gt—up 54% since 2000.11,27 Global energy-related CO₂ emissions are projected to increase by 15% from 2022–2050.15
- F-gases are the fastest-growing GHGs. In 2023, global F-gas emissions increased by 4.2%, CH₄ by 1.3%, N₂O by 1.1%.10
- The U.S. has emitted the most cumulative CO₂, followed by the EU and China. India and the African Union have produced a minor share despite large populations.10
- Since 2005, China has surpassed the U.S. as the largest source of CO₂ emissions.14 In 2023, China’s per capita GHG emissions were twice the global average, while the U.S. was three times the global average.8
- Globally, the top 10% of income earners were responsible for 48% of emissions—two-thirds of whom live in developed countries. The bottom 50% contributed just 12%.12 See the Environmental Justice Factsheet.
- CO₂ emissions in the Americas are expected to fall 0.2% annually; a 0.7% decline in the U.S. and 0.5–1.4% increases everywhere else. Total emissions in Africa are projected to increase 1.2% yearly, but will remain the lowest globally.15
United States
- The U.S. represents 4.2% of the world’s total population,16 and 11% of annual anthropogenic GHG emissions in 2023.8
- CO₂ accounts for 80% of U.S. GHG emissions. The largest source of CO₂ in the U.S. is fossil fuel combustion (74%), primarily from transportation and power generation.5
- In 2022, CO₂ emissions were 1.5% lower than in 1990 and 18% lower than in 2005. GHG emissions were 3% below 1990 levels; an average annual decline of 0.1%.5
- Since 2005, GHG and fossil fuel emissions fell by 15% and 18% respectively, while GDP grew 36%.5
- Livestock, natural gas, and landfills are the primary sources of CH₄.5 CH₄ emissions from the oil and gas industry were 13 Mt (2.3% of gross production)—60% higher than EPA estimates. The climate impact rivals CO₂ emissions from combustion.17
- HFC and PFC emissions increased since 1990, driven by the phase-out of O₃-depleting CFCs, making up 90% of F-gas emissions in 2022. SF₆ emissions declined by 80%, attributed to a rise in prices in the 1990s and EPA intervention.5
U.S. GHG Emissions by Sector (Mt CO2e)5
- Transportation has been the largest source of U.S. GHG emissions since 2017, accounting for 28% in 2022. Emissions were 8% below 2005 levels but 18% above 1990, driven by growing travel demand, urban sprawl, and low fuel prices.5
- Passenger cars and light-duty trucks emitted 370 and 660 Mt CO₂e, respectively, accounting for 57% of U.S. transportation emissions and 16% of total U.S. emissions.5
- The electric power sector accounts for 25% of total U.S. GHG emissions. This is the only sector showing major declines; down 16% since 1990 and 36% since 2005.5
- The residential sector accounts for 15% of U.S. emissions, driven by electricity use and consumption of natural gas and petroleum.5
- Emissions have risen since 1990 due to population growth, migration to warmer regions, and larger houses. Recent trends reflect a shift toward energy efficiency.5
- The land use and forestry sector offsets 14% of U.S. emissions, absorbing CO₂ through plant and tree growth.5
Average Annual CO2 Emissions by Activity, 2020 (lbs)18,19
Solutions
- Stabilizing global temperatures and limiting climate change impacts require net-zero or net-negative emissions.20
- Any rise in global warming harms human health, with greater mortality, economic, and security risks above 1.5 °C. Limiting warming to 1.5 °C is projected to reduce ecosystem loss and species extinction compared to 2 °C.20
- GHG emissions can be reduced by transitioning from fossil fuels, improving energy efficiency, adopting sustainable agriculture and forest management, and conserving critical ecosystems.22
- International cooperation to mitigate climate change is established through the 1992 UN Framework Convention on Climate Change (UNFCCC) and its legal instruments—the 1997 Kyoto Protocol and the 2015 Paris Agreement.9 See the Climate Change: Policy and Mitigation Factsheet.
- Nationally Determined Contributions (NDCs) are countries’ self-defined climate pledges under the Paris Agreement, outlining their commitments to limit global warming to 1.5 °C.23 As of September 2024, the 168 latest NDCs cover 95% of total global emissions in 2019.24
- Global GHG emissions must fall 43% from 2019 levels by 2030 and reach net-zero by 2050 to limit warming to 1.5 °C.21
- Full implementation of latest NDCs cuts emissions by just 5.9%; this requires financial and technology transfer. Without transfers, emissions could rise 0.8%.24
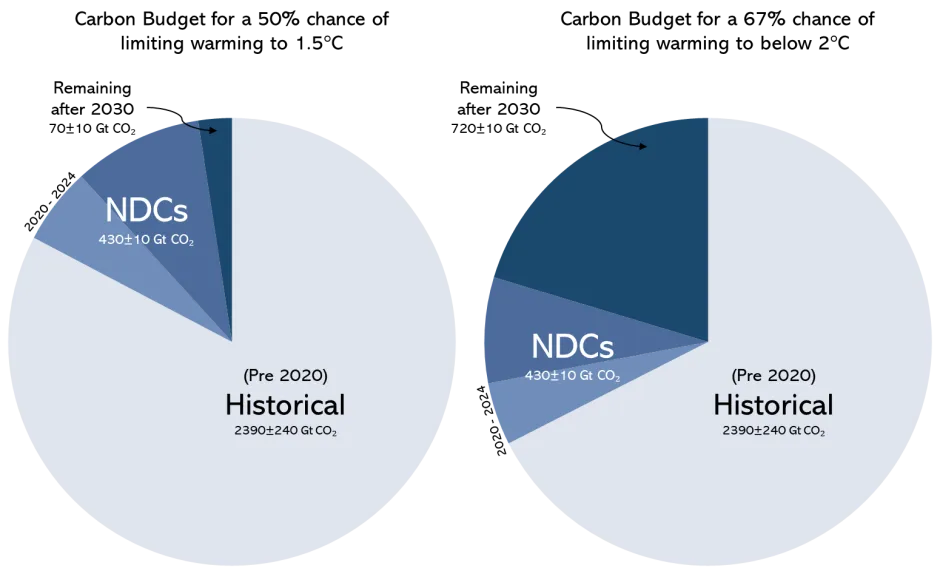
- Current NDCs would use 86% of the carbon budget—for a 50% chance of limiting warming to 1.5°C—by 2030, leaving only two years' worth of emissions after 2030, and requiring even steeper post-2030 reductions to stay on track for 1.5 °C or well below 2 °C warming.24
- Under current assumptions, 21st century warming is projected to reach 2.1 °C – 2.8 °C.24
- As of September 2024, 60% of the world's largest companies have set net-zero emissions targets, covering $31T or 67% of aggregate annual revenue.25
Global CO2 Emissions Budget24
Center for Sustainable Systems, University of Michigan. 2025. "Greenhouse Gases Factsheet." Pub. No. CSS05-21.
References
1. Intergovernmental Panel on Climate Change (IPCC) (2021) Climate Change 2021: The Physical Science Basis.
https://www.ipcc.ch/report/sixth-assessment-report-working-group-i/
2. Spencer Weart (2024) The Carbon Dioxide Greenhouse Effect
https://history.aip.org/climate/co2.htm
3. World Meteorological Organization (2024) Greenhouse Gas Bulletin
https://wmo.int/news/media-centre/greenhouse-gas-concentrations-surge-again-new-record-2023
4. IPCC (2022) Climate Change 2022: Mitigation of Climate Change.
https://www.ipcc.ch/report/ar6/wg3/downloads/report/IPCC_AR6_WGIII_FullReport.pdf
5. U.S. Environmental Protection Agency (EPA) (2024) Inventory of U.S. Greenhouse Gas Emissions and Sinks: 1990–2022.
https://www.epa.gov/ghgemissions/inventory-us-greenhouse-gas-emissions-and-sinks-1990-2022
6. National Oceanic and Atmospheric Administration (NOAA) (2025) “Trends in Atmospheric Carbon Dioxide.”
https://gml.noaa.gov/ccgg/trends/global.html
7. Center for Climate and Energy Solutions (2021) "Short-lived Climate Pollutants."
https://www.c2es.org/content/short-lived-climate-pollutants/
8. EDGAR (2024) GHG emissions of all world countries 2024
https://edgar.jrc.ec.europa.eu/report_2024
9. IPCC (2022) Climate Change 2022: Mitigation of Climate Change, Chapter 14 International Cooperation
https://www.ipcc.ch/report/ar6/wg3/downloads/report/IPCC_AR6_WGIII_Chapter14.pdf
10. UNEP (2025) Emissions Gap Report 2024
https://www.unep.org/resources/emissions-gap-report-2024
11. IEA (2024) CO2 Emissions in 2023
12. UNEP (2023) Emissions Gap Report 2023
https://wedocs.unep.org/bitstream/handle/20.500.11822/43922/EGR2023.pdf?sequence=3&isAllowed=y
14. U.S. Energy Information Administration (EIA) (2023) World CO2 Emissions
https://www.eia.gov/international/data/world/total-energy/more-total-energy-data
15. U.S. EIA (2023) International Energy Outlook 2023
https://www.eia.gov/outlooks/ieo/
16. U.S. EIA (2025) Monthly Energy Review May 2025
https://www.eia.gov/totalenergy/data/monthly/
17. Alvarez, R., et al (2018) "Assessment of methane emissions from the U.S. oil and gas supply chain." Science, 361: 186-188.
http://science.sciencemag.org/content/361/6398/186.full
20. IPCC (2018) Special Report: Global Warming of 1.5 C.
21. IPCC (2023) Synthesis Report of the IPCC Sixth Assessment Report (AR6) Summary for Policymakers.
https://www.ipcc.ch/report/ar6/syr/
22. UNDP (2024) What is climate change mitigation and why is it urgent?
https://climatepromise.undp.org/news-and-stories/what-climate-change-mitigation-and-why-it-urgent
23. UNDP (2023) What are NDCs and how do they drive climate action
24. UNFCCC (2024) 2024 NDC Synthesis Report
25. Net Zero Tracker (2024) Net Zero Stocktake 2024
https://zerotracker.net/analysis/net-zero-stocktake-2024
26. EPA (2025) Global Greenhouse Gas Overview
https://www.epa.gov/ghgemissions/global-greenhouse-gas-overview
27. IEA (2025) Global Energy Review