U.S. Cities Factsheet
Large, densely populated, and bustling with activity, cities are cultural and economic centers, providing employment, leisure, and educational opportunities. Energy and resources flow in and out of cities to support their population and infrastructure. However, there is increasing attention on the environmental impacts of cities, and the significant opportunity for reducing the impact of the built environment and improving the livelihoods of urban residents.
Urban Land Use Patterns
- It is estimated that 83% of the U.S. population lives in urban areas, up from 64% in 1950. By 2050, 89% of the U.S. population and 68% of the world population is projected to live in urban areas.1
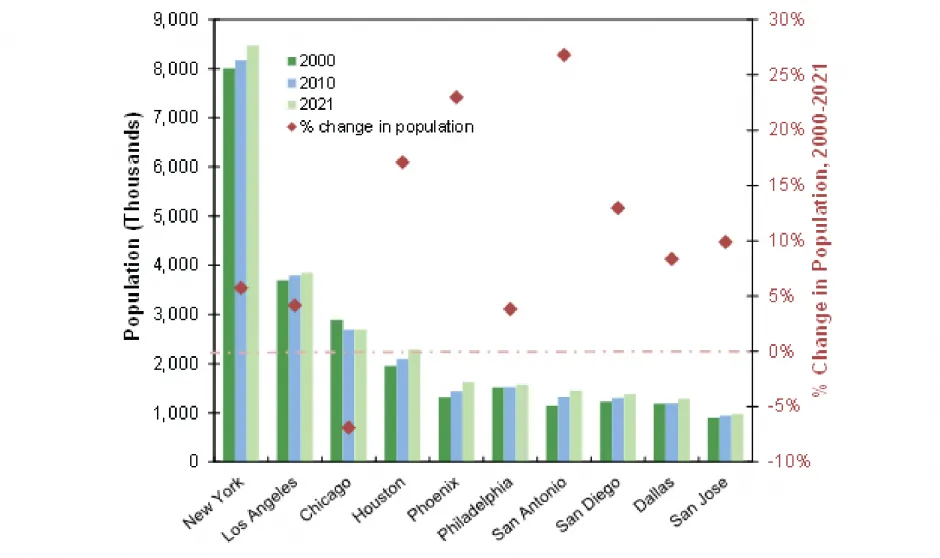
- More than 325 urban areas in the U.S. have populations above 100,000; New York City, with 8.47 million inhabitants, is the largest.3,4
- While the rate of urbanization, i.e., the changing of land from forest or agricultural uses to suburban and urban uses, is decreasing, an increasing percentage of the world’s population is living in urban centers.5,6 Between 2000 and 2010, urban land area in the U.S. increased by 15%. Urban land area is 106,386 square miles, or 3% of total land area in the U.S., and is projected to more than double by 2060.7,8,9
- The average population density of the U.S. is 94 people per square mile.10
- The average population density of metropolitan statistical areas (MSA) is 283 people per square mile; in New York City, the population density is 29,303 people per square mile.4,7 The county of New York, New York has the greatest density of housing units (40,339) per square mile of land area.8
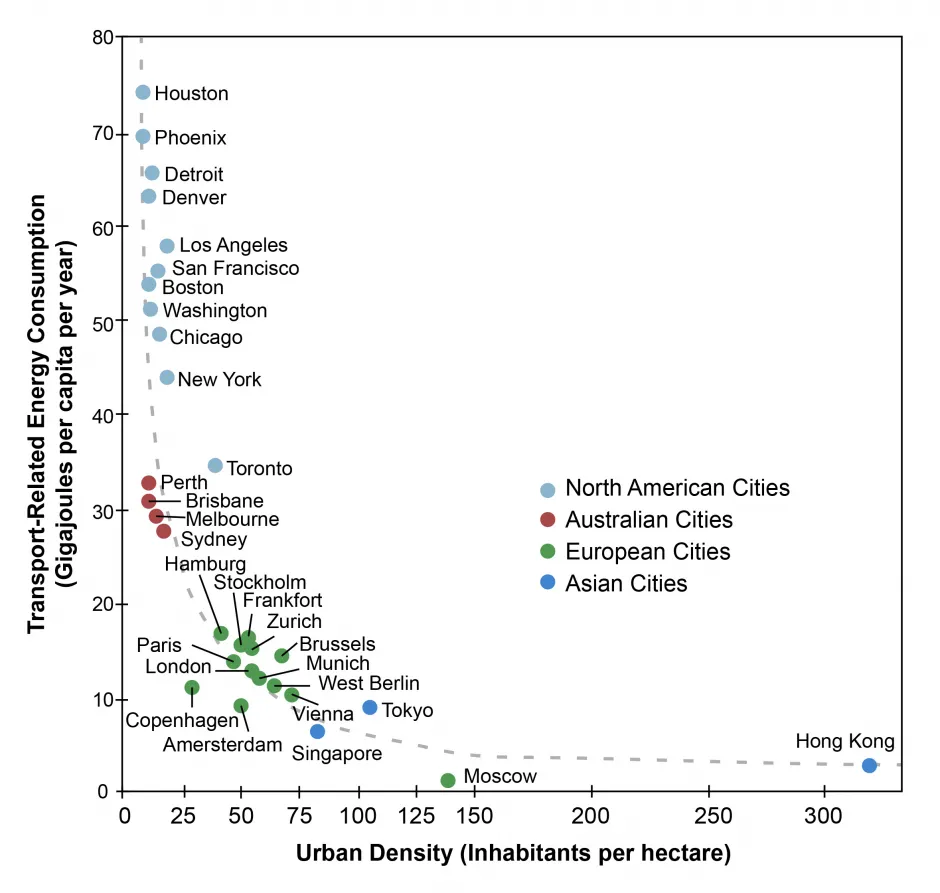
- One study found that doubling population-weighted urban density reduces CO₂ emissions from household travel and residential energy use by 48% and 35%, respectively.11
- Sprawl, the spreading of a city and suburbs into surrounding rural land, increases traffic and energy use, and results in air and water pollution and flooding.12
- According to Smart Growth America’s Sprawl Index (based on development density, land use mix, activity centering and street accessibility), the most sprawling MSAs of the 221 surveyed are Hickory-Lenoir-Morganton, NC, Atlanta-Sandy Springs-Marietta, GA, Clarksville, TN-KY, and Prescott, AZ. The least sprawling metropolitan areas include New York/White Plains/Wayne, NY-NJ, San Francisco/San Mateo/ Redwood City, CA, Atlantic City/Hammonton, NJ, and Santa Barbara/Santa Maria/Goleta, CA.13
Population Trends of the Largest U.S. Cities, 2000-20212,3

Built and Natural Environment
- Residential (21.8 quadrillion Btu; “quads”) and commercial (18.2 quads) sectors accounted for 40% of total energy consumption and 35% (1,741 million metric tons, Mt, of CO2) of energy-related emissions in 2022.15
- Approximately 70% of global emissions can be attributed to urban areas, driven by population size, income, and state and form of urbanisation.16
- The “urban heat island effect,” in which average annual temperatures are 1-7°F higher in cities than surrounding suburban and rural areas, results in increased energy demand, air pollution, GHG emissions, and heat-related illness, as well as decreased water quality.17
- Urban tree canopies decrease the urban heat island effect.18 Urban tree cover in the U.S. is 39.4% and has been declining, while impervious surfaces have expanded to 26.6% of urban areas.9
- Air Quality Index is an important environmental metric monitored in cities. Since 2000, emissions from key pollutants have decreased and, with them, the number of unhealthy air days for urban residents.19
- The concentration and toxicity of contaminants in streams increases with the degree of urban development. Pollutants are introduced from runoff, treated sewage, and industrial processes.20
- Vegetation and topsoil loss and the constructed drainage networks associated with urbanization alter natural hydrology.21
- Stormwater runoff from the built environment is a principal contributor to water quality impairment of water bodies nationwide.21
- Hot extremes have intensified in cities, which worsens air pollution events and has compromised key infrastructure such as transportation, water, and sanitation.16
Transportation and Mobility (See Personal Transportation Factsheet)
- In 2020, 32.9 billion passenger-miles (PM) were traveled on U.S. public transit, a 41% decrease from the 56.1 billion PM traveled in 2019 as a result of COVID-19 pandemic.22 Similarly, vehicle-miles traveled (VMT) decreased by 11% to 2.9 trillion VMT in 2020. 3.1 trillion VMT occurred on public roads in 2021.23
- There are 23 light rail, 15 heavy rail, and 30 commuter rail systems in the U.S. If pre-pandemic trends had continued, fixed-guideway modes of public transit (light and commuter rail) would soon have had a greater share of passenger trips than roadway modes (buses).22 Without public transportation, the annual impacts in the U.S. would include an additional 102.2 billion VMT, 5.3 billion gallons of gasoline, and 37 Mt of CO₂ emissions.24
- Congestion is a serious problem in urban areas, causing an additional 8.7 billion hours of travel time and an extra 3.5 billion gallons of fuel use by urban Americans in 2019.25
- In 2019, transit buses used 89.5 trillion Btu and traveled 19.3 billion PM, while rail used 47.1 trillion Btu and traveled 39.3 billion PM. In comparison, passenger cars and trucks used 15,108 trillion Btu and traveled 4,470 billion PM.26
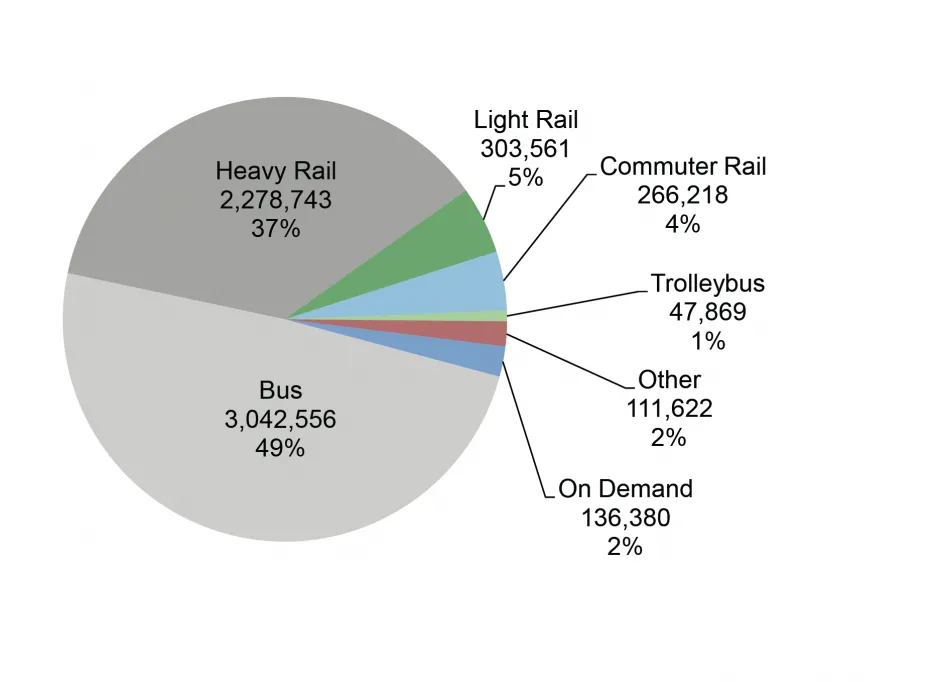
- By number of riders, New York City has the most utilized heavy rail, commuter rail, and bus systems in the U.S., San Diego has the most utilized light rail system, and San Francisco has the most utilized trolley bus system.27
- Between 2020 and 2022, there was an overall 33% increase in total public ridership on all modes of public transportation.27,28
Urban Density and Transportation-Related Energy Consumption14

Public Transportation Ridership, 202227 (number of passenger trips)

Socioeconomic Patterns
- In 2018, U.S. metro economies account for 91.1% of GDP, 91.8% of wage income, and 88.1% of jobs. Only 9 countries (including the U.S.) had a higher GDP than the New York City area.29
- The median household income inside MSAs is $73,823; outside MSAs it is $53,750.30 The average unemployment rate of metropolitan areas in February 2023 was 3.9%, ranging from a low of 1.9% in Ames, IA and Madison, WI to a high of 15.6% in El Centro, CA.31
- Poverty rates are lower within metropolitan areas than outside: 11% compared to 14.1% in 2020.32
Solutions and Sustainable Alternatives
A sustainable urban area is characterized by the preservation of a quality environment, efficient use of renewable energy resources, the maintenance of a healthy population with access to health services, and the presence of economic vitality, social equity, and engaged citizenry.33 An integrated approach to environmental management, measures to counter sprawl, the establishment of linkages among community, ecology, and economy, and coordinated stakeholder interaction are necessary for achieving sustainability in cities.33,34
- Well-being in urban areas can be improved by prioritizing means to reduce climate risk for low-income and marginalized communities.16
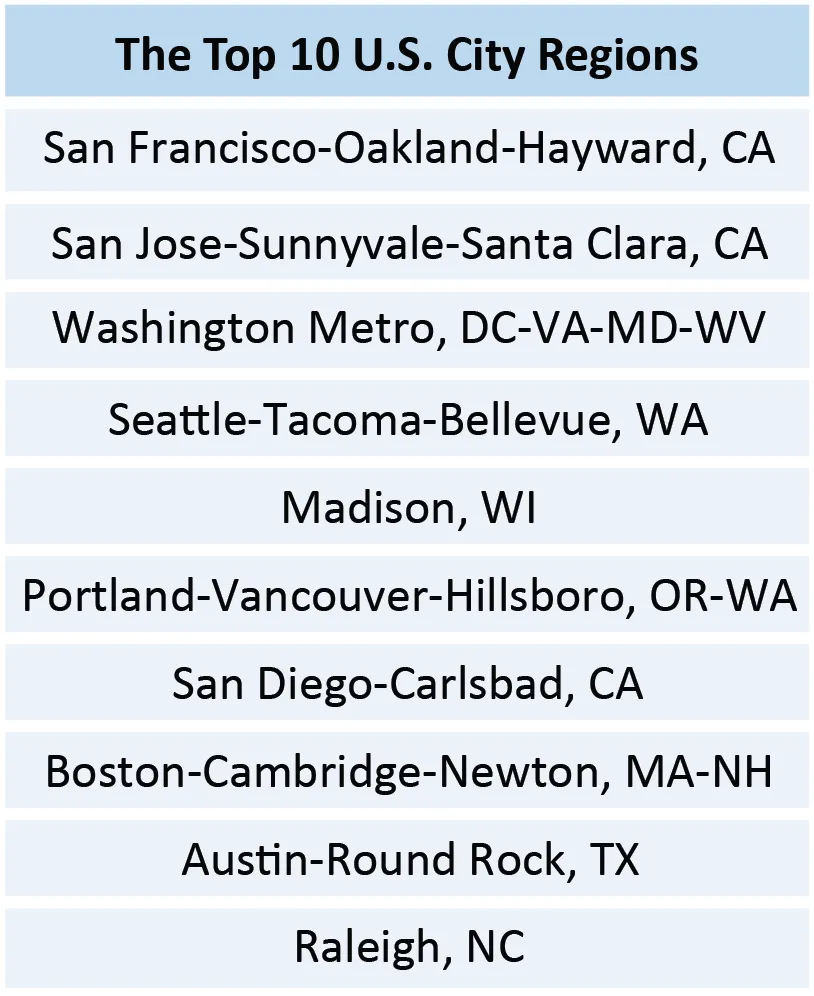
- The San Francisco-Oakland-Hayward metro region in California placed first on a United Nations’ Sustainability Development Goal (SDG) Index ranking based on 57 indicators across 15 of the 17 SDGs.35
- As of November 2019, 1,066 mayors have signed on to the 2005 U.S. Mayors Climate Protection Agreement, committing to reduce carbon emissions below 1990 levels, in line with the Kyoto Protocol.36
- A National Oceanic and Atmospheric Administration report found that as of 2017, 455 U.S. cities surveyed had plans for reducing GHG emissions.37 Many cities, including New York, Los Angeles, and Chicago, have created Climate Action Plans, demonstrating environmental leadership and commitment to reducing climate change.38
- The EPA offers many clean energy programs, information, training opportunities, grants, resources, and tools to assist local governments.
- ICLEI (International Council for Local Environmental Initiatives), an international association of local governments and national, regional, and local government organizations, develops locally designed initiatives to achieve sustainability objectives.39
- Smart Growth America is a coalition working to improve the planning and building of towns, cities, and metro areas.40
- The U.S. DOE’s Clean Cities Coalition Network works locally in advancing affordable and efficient transportation.41
- The U.S. EPA’s Local Government Solar Project Portal provides guidance to local governments for community-wide solar power deployment.42
SDG Index Ranking, 201932

Center for Sustainable Systems, University of Michigan. 2023. “U.S. Cities Factsheet.” Pub. No. CSS09-06.
References
- United Nations (UN) Population Division (2018) World Urbanization Prospects: The 2018 Revision.
- U.S. Census Bureau (2011) “Incorporated Places with 100,000 or More Inhabitants in 2010.”
- U.S. Census Bureau (2022) City and Town Population Totals 2020-2021, Incorporated Places of 50,000 or More.
- U.S. Census Bureau (2021) QuickFacts New York City, New York.
- The World Bank (2022) Urban Population (% of total population).
- The World Bank (2022) Urban Population Growth (Annual %).
- U.S. Census Bureau (2012) United States Summary: 2010 Population and Housing Unit Counts. 2010 Census of Population and Housing.
- U.S Census Bureau (2023) County-level Urban and Rural information for the 2020 Census.
- Nowak, D. and E. Greenfield (2018) Declining Urban and Community Tree Cover in the United States. Journal of Urban Forestry and Urban Greening: 32-55.
- U.S. Census Bureau (2021) “Historical Population Density Data (1910-2020).”
- Lee, S., and Lee, B. (2014) The Influence of Urban Form on GHG Emissions in the U.S. Household Sector. Journal of Energy Policy, 68: 534-549.
- European Environment Agency (2004) “Glossary: Urban Sprawl.”
- Ewing, R., Shima Hamidi. (2014) Measuring Sprawl 2014. Smart Growth America.
- Adapted from UNEP (2008) “Kick the Habit: A UN Guide to Carbon Neutrality.”
- U.S. Energy Information Administration (EIA) (2023) Monthly Energy Review March 2023.
- Intergovernmental Panel on Climate Change (IPCC) (2023) Synthesis Report of the IPCC Sixth Assessment Report (AR6) Longer Report.
- U.S. Environmental Protection Agency (EPA) (2020) “Learn About Heat Islands.”
- Nowak, Greenfield (2012) Tree and impervious cover in the United States. Landscape and Urban Planning: 21-30.
- U.S. EPA (2021) Our Nation’s Air.
- USGS (2012) Effects of Urban Development on Stream Ecosystems in Nine Metropolitan Study Areas Across
- National Research Council (2008) Urban Stormwater Management in the United States.
- American Public Transportation Association (2022) Public Transportation Factbook.
- U.S. Department of Transportation, Bureau of Transportation Statistic (2023) U.S. Vehicle Miles 2021.
- APTA (2008) The Broader Connection between Public Transportation, Energy Conservation and Greenhouse Gas Reduction.
- Texas A&M Transportation Institute (2021) 2021 Urban Mobility Report.
- U.S. Department of Energy (DOE), Oak Ridge National Lab (2022) Transportation Energy Data Book: Edition 40
- APTA (2023) Public Transportation Ridership Report, Fourth Quarter 2022.
- APTA (2021) Public Transportation Ridership Report, Fourth Quarter 2020.
- The United States Conference of Mayors (2019) U.S. Metro Economies - GMP and Employment 2018-2020.
- U.S. Census Bureau (2022) Income in the United States 2021.
- U.S. Department of Labor, Bureau of Labor Statistics (2023) Unemployment Rates for Metropolitan Areas.
- U.S. Census Bureau (2021) Income and Poverty in the United States: 2020.
- Budd, W., et al. (2008) “Cultural sources of variations in U.S. urban sustainability attributes.” Cities, 25(5): 257-267.
- Hecht, A. and W. Sanders (2007) “How EPA research, policies, and programs can advance urban sustainability.” Sustainability: Science, Practice, & Policy, 3(2): 37-47.
- UN Sustainable Development Solutions Network (2019) The 2019 US Cities Sustainable Development Report.
- U.S. Conference of Mayors (2020) Mayors Climate Protection Center.
- National Oceanic and Atmospheric Administration (2019) “National Climate Assessment: States and cities are already reducing carbon emissions to save lives and dollars.”
- U.S. EPA (2014) “Climate Change Action Plans.”
- ICLEI Global (2021) “About Us.”
- Smart Growth America (2021) “About Us.”
- U.S. DOE Clean Cities (2021) “About Clean Cities.”
- U.S. EPA (2020) “Local Government Solar Project Portal.
