Personal Transportation Factsheet
The predominant mode of travel in the U.S. is automobiles and light trucks, accounting for 86% of passenger miles traveled in 2023.1 The U.S. has just over 4% of the world’s population, but owns 11% of the world’s cars. By comparison, China owns 20%, Japan 6%, Germany 4%, and Russia 5%.2,3 Since 1990, China (18%), India (9.8%), and Indonesia (9.6%) have seen the highest growth in registered cars. Transportation use patterns indicate that the current system is unsustainable.3
Patterns of Use
Miles Traveled
- In 2023, Americans traveled 5.1T person-miles.1
- From 1990 to 2023, the U.S. population grew by 34%,4,23 while vehicle miles traveled (VMT) rose by 51%.1
- 69% of VMT occurred in urban areas.1
Vehicles and Occupancy
- U.S. average vehicle occupancy declined from 1.87 persons per vehicle mile in 1977 to 1.5 in 2019.3,5
- In 2023, the U.S. had 285M registered vehicles and 238M licensed drivers.1
- In 2022, 21% of U.S. households had three or more vehicles, 4% less than in 2017.6,7
Production Share by Model Year and Vehicle Type8
Average Fuel Economy
- New vehicle fuel economy declined from 22 mpg in 1987 to 19 in 2004, then steadily increased, reaching 27 mpg for the 2023 model year.8
- Fuel economy varies by vehicle type, from 20.5 mpg for pickups to 34.1 for sedans/wagons and 40.5 for car SUVs.8
- In 2020, the U.S. had one of the lowest fuel economy standards among industrialized nation, below the EU, China, and Japan.9 Proposed standards for 2027–2032 (60–66 mpg) would close this gap.25
Fuel Economy by Model Year8
Vehicle Size and Power
- From 1990 to 2023, average new vehicle weight increased by 28%, largely driven by SUV market growth. Passenger car weight increased by 15%, while pickup truck weight rose by 32%. Horsepower increased by 97%, and 0–60 mph acceleration times improved by 37%.8
- SUVs and pickups accounted for 73% of new vehicles sold in the U.S. in 2023—58% was from SUVs alone.8
- Most of the energy spent in wheeled transportation and aircraft is used to move vehicle mass. Lightweighting can improve energy efficiency.10
Energy Use
- The transportation sector makes up 28% of U.S. energy use.3 Since 1990, energy use in the sector grew by 20%, while its share of total U.S. energy use rose by just 1%.3
- In 2019, U.S. cars and light trucks used 15.1 quads of energy, representing 15% of national energy consumption.3
- In 2024, 93% of primary energy used in transportation came from fossil fuels, with 88% from petroleum.11
- In 2022, the transportation sector produced 1,802 Mt CO₂e, 28% of U.S. greenhouse gas (GHG) emissions.12
- In 2022, passenger cars emitted 370 Mt CO₂e and light trucks 660 Mt CO₂e. Together, they contributed 57% of U.S. transportation emissions and 16% of total U.S. emissions.12
Life Cycle Impacts
- A typical passenger car generates various burdens during its lifetime (raw material extraction through end-of-life). Most impacts are due to fuel production and vehicle operations.13
- Vehicle lifetime energy use for fuel production is 1.22 MJ/mi, for vehicle operations is 4.54 MJ/mi, and for material production, manufacturing, maintenance, and end-of-life combined is 0.56 MJ/mi.13
- GHG emissions (g CO2e/mi) for a current technology small SUV are 429 for an ICEV, 312 for a PHEV, 258 for an HEV, and 267 for a BEV with 200-mi range.22
Solutions and Sustainable Actions
Reduce Vehicle Miles Traveled
- Driving to/from work represents 30% of all vehicle miles driven, the average trip is 12 mi. Consider living closer to work or working from home.3
- In 2020, 75% of U.S. workers commuted by driving alone, while only 9% of workers carpooled (down from 20% in 1980).3 Carpooling can reduce household fuel costs, cut GHG emissions, and reduce traffic congestion.
- 20% of vehicle trips are shopping-related. Combine errands (trip chaining) to avoid unnecessary driving.3
- In 2022, traffic congestion cost Americans 8.5B extra hours on the road and 3.3B additional gal of gas, 5% and 8% lower than 2019 levels respectively. Switching to bikes, buses, or trains can cut GHG emissions and save time and money.14
- Micromobility (e.g., bikes, scooters) and shared transportation services (e.g., bike shares) have grown rapidly. In 2019, 136M trips were taken by shared micromobility users, over 6 times the number in 2015.3
Improve Energy Efficiency
- Consider buying a best-in-class vehicle for fuel economy. The U.S. EPA and DOE publish an annual Fuel Economy Guide ranking the most efficient models.15
- Drive responsibly. Aggressive driving and speeding can lower gas mileage by 10% to 40%.16
- Gallons per mile (gpm) is a better indicator of fuel efficiency than miles per gallon (mpg). For instance, upgrading from a vehicle that gets 16 mpg to one that gets 20 mpg saves 125 gallons of fuel over 10,000 miles, whereas upgrading from a vehicle that gets 34 mpg to one that gets 50 mpg saves only 94 gallons over the same distance.17
- When driving electric vehicles (EVs), follow battery charging best practices to extend battery life and minimize GHG emissions.18 See Electric Vehicles Factsheet.
Energy Intensity of U.S. Passenger Travel, 20193
Promote Supportive Public Policy
- Dense, mixed-use communities promote walking and biking by reducing travel time between homes, businesses, and workplaces.
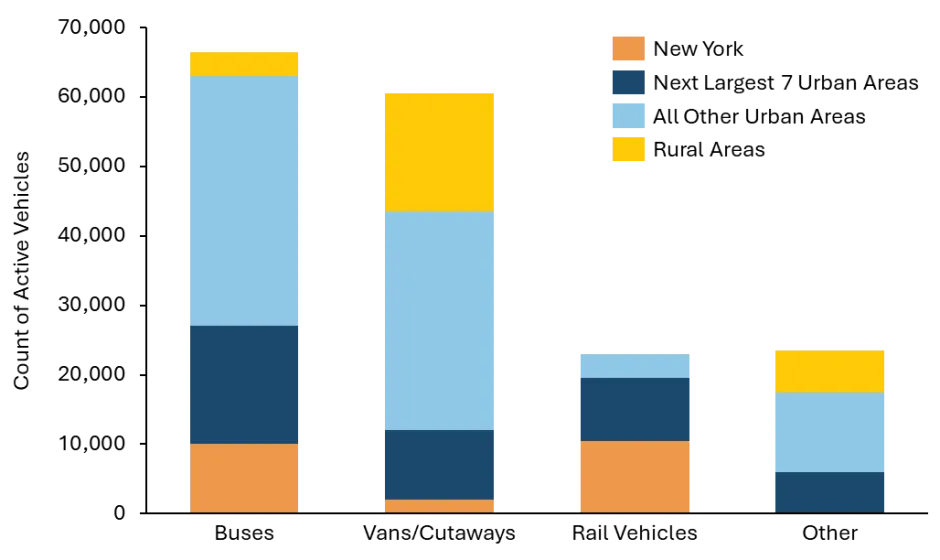
- Support policies that invest in public transit infrastructure. Transit availability is highly concentrated. Eight urbanized areas account for 72% of all transit trips, with New York making up 45%, and rural areas 2%.26
U.S. Public Transit Availability, 202326
- The EPA set new emissions standards for light- and medium-duty vehicles for model years 2027–2032, aiming to reduce tailpipe emissions to 85 g/mile by 2032—50% lower than the 2027 standard.19
- In 2024, new fuel economy standards were set for model years 2027–2031, including a 2% annual increase for passenger cars and raising corporate average fuel economy (CAFE) to 50.4 mpg for new light-duty vehicles by 2031.20
- Fuel economy standards tied to vehicle size may encourage a shift toward larger vehicles—a current trend—which could increase traffic safety risks. Predicted vehicle size increases of 2–32% under such policies could offset fuel economy gains by 1–4 mpg.21
- In 2025, the EPA announced major changes including the reconsideration of climate regulations, GHG reporting requirements, clean energy initiatives, and reversal of vehicle emissions standards.27
Center for Sustainable Systems, University of Michigan. 2025. "Personal Transportation Factsheet." Pub. No. CSS01-07.
References
1. U.S. DOT Federal Highway Administration (FHWA) (2024) Highway Statistics 2023
https://www.fhwa.dot.gov/policyinformation/statistics/2023/
2. U.S. Central Intelligence Agency (CIA) (2024) The World Factbook.
https://www.cia.gov/the-world-factbook/countries/world/#people-and-society
3. U.S. Department of Energy (DOE), Oak Ridge National Lab (2022) Transportation Energy Data Book Edition 40.
4. U.S. Census Bureau (2024) 2024 National Population Totals and Components of Change 2020-2024
https://www.census.gov/data/tables/time-series/demo/popest/2020s-national-total.html
5. U.S. DOT (1981) Vehicle Occupancy: Report 6, 1977 National Personal Transportation Study.
http://www.fhwa.dot.gov/ohim/1977/g.pdf
6. U.S. DOT (2019) 2017 National Household Travel Survey.
7. U.S. DOT (2024) 2022 National Household Travel Survey.
8. U.S. Environmental Protection Agency (EPA) (2024) The 2024 EPA Automotive Trends Report.
https://www.epa.gov/automotive-trends/download-automotive-trends-report
9. International Council on Clean Transportation (2020) Passenger vehicle fuel economy.
https://theicct.org/pv-fuel-economy/
10. Lewis, G., et al. (2019) Green Principles for Vehicle Lightweighting
https://css.umich.edu/publication/green-principles-vehicle-lightweighting
11. U.S. Energy Information Administration (EIA) (2025) Monthly Energy Review May 2025.
http://www.eia.gov/totalenergy/data/monthly/
12. U.S. Environmental Protection Agency (EPA) (2024) Inventory of U.S. Greenhouse Gas Emissions and Sinks: 1990-2022.
https://www.epa.gov/ghgemissions/inventory-us-greenhouse-gas-emissions-and-sinks
13. Argonne National Laboratory (2023) The Greenhouse gases, Regulated Emissions, and Energy use in Technologies Model (GREET) 2022.
https://greet.es.anl.gov/index.php
14. Schrank, D., et al. (2024) 2023 Urban Mobility Report. Texas Transportation Institute.
https://mobility.tamu.edu/umr/
15. U.S. DOE and U.S. EPA (2025) Fuel Economy Guide.
https://www.fueleconomy.gov/feg/printGuides.shtml
16. U.S. DOE, Energy Efficiency and Renewable Energy (2018) “Driving More Efficiently.”
http://www.fueleconomy.gov/feg/driveHabits.shtml
17. Larrick, R. and J. Soll (2008) "The MPG Illusion." Science, 320(5883): 1593-94.
http://nsmn1.uh.edu/dgraur/niv/theMPGIllusion.pdf
18. Woody, M., et al. (2021) Charging Strategies to Minimize Greenhouse Gas Emissions of Electrified Delivery Vehicles.
19. US EPA (2024) Multi-Pollutant Emissions Standards for Model Years 2027 and Later LightDuty and Medium-Duty Vehicles
https://www.govinfo.gov/content/pkg/FR-2024-04-18/pdf/2024-06214.pdf
20. National Highway Traffic Safety Administration (NHTSA) (2024) USDOT Finalizes New Fuel Economy Standards for Model Years 2027-2031.
21. Whitefoot, K. S., & Skerlos, S. J. (2012) Design incentives to increase vehicle size created from the U.S. footprint-based fuel economy standards. Energy Policy, 41, 402–411.
http://www-personal.umich.edu/~skerlos/design_whitefoot.pdf
22. Cradle-to-Grave Lifecycle Analysis of U.S. Light-Duty Vehicle-Fuel Pathways: A Greenhouse Gas Emissions and Economic Assessment of Current (2020) and Future (2030-2035) Technologies
https://www.osti.gov/biblio/1875764
23. U.S. Census Bureau (2000) National Population Estimates by Nativity from 1990 to 1999
https://www.census.gov/data/tables/time-series/demo/popest/1990s-national.html
25. International Council on Clean Transportation (2024) Passenger vehicle greenhouse gas emissions and fuel consumption
https://theicct.org/pv-fuel-economy/
26. U.S. Department of Transportation (DOT) Federal Transit Administration (FTA) (2024) National Transit Summaries and Trends - 2023 Edition
https://www.transit.dot.gov/ntd/national-transit-summaries-and-trends-ntst
27. EPA (2025) EPA Launches Biggest Deregulatory Action in U.S. History
https://www.epa.gov/newsreleases/epa-launches-biggest-deregulatory-action-us-history