

Electric Vehicles Factsheet
Types of Electric Vehicles
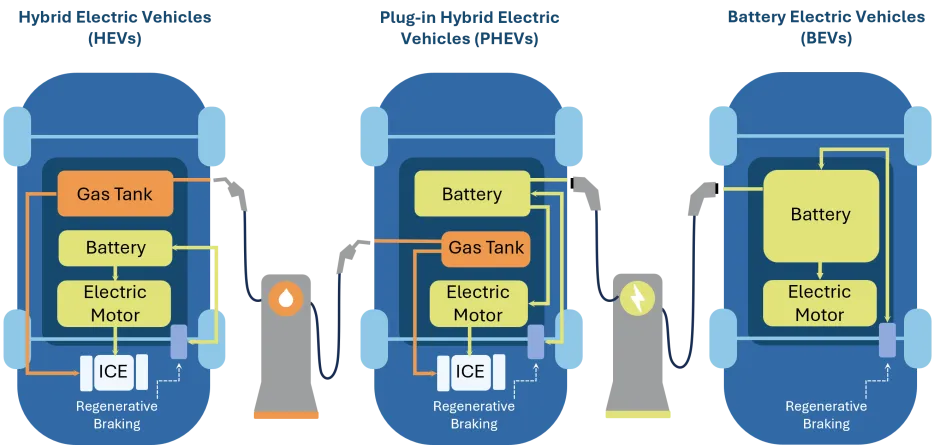
- Battery electric vehicles (BEVs), or all-electric vehicles, are powered exclusively by an electric motor and onboard battery that is usually recharged from the grid.1 They perform best in moderate temperatures and offer better range in cities due to regenerative braking.2 BEVs produce no tailpipe emissions, though their electricity source may still generate emissions.3
- Plug-in hybrid electric vehicles (PHEVs) use both an internal combustion engine (ICE) and an electric motor with a battery that can be charged from the grid, enabling the vehicle to run on liquid fuel and in all-electric mode. PHEVs can travel 25–54 mi on electricity before switching to gasoline.1,36,37 In this factsheet, both PHEVs and BEVs are referred to as EVs.
- Hybrid electric vehicles (HEVs) use an ICE and one or more electric motors that use energy stored in a battery. Unlike in BEVs and PHEVs, an HEV battery is charged by the ICE and regenerative braking rather than by plugging in.1
- Fuel cell electric vehicles (FCEVs) convert energy stored as hydrogen into electricity using a fuel cell. Like BEVs, FCEVs produce no harmful tailpipe emissions—only water vapor, oxygen, and heat. Their environmental impact depends on the hydrogen production process.4
- Vehicles that produce no emissions from the onboard power source—including BEVs and FCEVs—are called zero emission vehicles (ZEVs).2
Electric Vehicle Comparison13
Image
Electric Vehicle Technology
- Since BEVs run solely on electricity, they do not have ICEs, liquid fuel components, or exhaust systems.5
- Electric motors drive the wheels using energy from a traction battery pack, which stores electricity for this purpose. Some EVs use motors with both drive and regeneration functions.5
- Battery size, chemistry, and vehicle efficiency determine the vehicle’s range. New BEVs offer 141–512 mi on a full charge.8
- BEVs use three types of lithium-ion batteries: lithium iron phosphate (LFP), lithium manganese cobalt oxide (NMC), and lithium nickel-cobalt-aluminum oxide (NCA).2 LFP is lower-cost and prevalent in China.6 NMC is more common in the U.S. and Europe.6
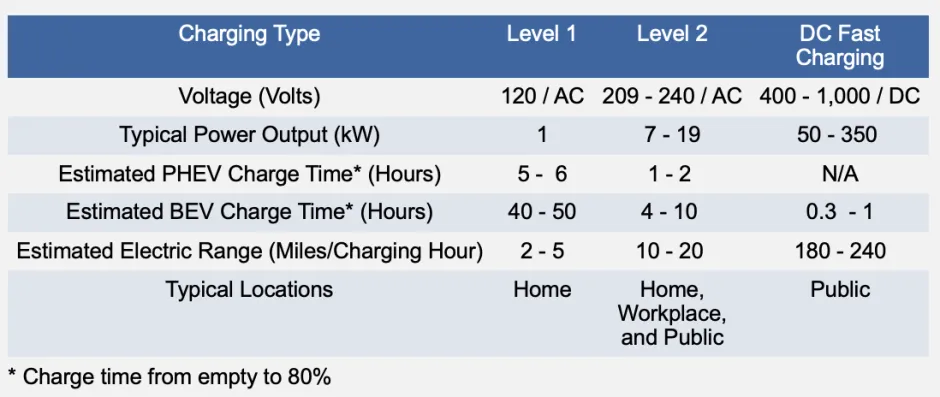
- EVs can be charged using electric vehicle service equipment (EVSE) at varying speeds. Level 1 (standard outlet) can take 40+ hours to charge a BEV to 80%. Level 2 can charge in as little as 4 hours, while Direct Current Fast Charging (DCFC) can take as little as 20 minutes.7
- Level 2 and DCFC chargers are available at many public locations in the U.S. As of 2026, there are 246 thousand charging stalls, 29% of which are DCFC.12
Overview of EV Chargers7
Image
Current Market
Market Leaders
- In 2025, EVs made up 9.1% of light-duty vehicle (LDV) sales in the U.S., down from 9.9% in 2024.9
- In 2025, 1.5M EVs were sold in the U.S. This is a 4% decrease from 2024. 1.2M of these were BEVs.9
- In 2010, BEVs accounted for only 0.002% of LDVs sold in the U.S.10
- Over 25% of new car sales globally were EVs, with 21M sold in 2025. This is a >20% increase from the previous year. Almost half of car sales in China in 2024 were EVs, representing 64% of global EV sales. Europe made up 20%.6
- Norway neared total electrification of sales, with 88% being BEVs and 3% PHEVs.6
- Cheap EVs and policy incentives have accelerated EV adoption in emerging markets. Sales of EVs in Brazil and Africa more than doubled from 2023 to 2024.6
- Government spending on EVs declined from 20% of EV cost in 2017 to 7% in 2024, as credits and incentives phased out. Buyer spending on EVs grew, reaching $560B in 2024.6
Policies and Incentives
- In 2023, California approved a first-in-nation ZEV regulation, requiring 100% of new LDVs sold to be ZEVs by 2035.14 By the end of 2023, 17 states and DC had adopted ZEV regulations.15 California’s ZEV mandate has been challenged by the U.S. Transportation Department.17
- Under the 2022 Inflation Reduction Act, eligible new EV purchases qualified for a federal tax credit of up to $7,500 through 2032. Recent legislation ended this program in September 2025.11,16
- In 2023, 14 state governments provided BEV incentives for buyers, with an average value of around $2,000.15 View local and state incentives at dsireusa.org.
- The Infrastructure Investment and Jobs Act allocated $7.5B to build a nationwide network of 500k EV chargers.24 The Transportation Department paused the program in February 2025, at which point $527M had been spent by U.S. states.18 After a preliminary injunction in June, the Transportation Department restored the program in August 2025.19,20
Limitations and Barriers
- Lithium-ion batteries in BEVs consist of cells within the battery pack. These batteries contain minerals such as lithium, nickel, cobalt, manganese, graphite, and copper. As a result, BEVs contain about six times more minerals by mass than ICEVs.25
- Most critical minerals used in BEVs are found in the batteries (lithium, cobalt, manganese, nickel, and graphite) and the electric motors (neodymium, praseodymium, dysprosium, and terbium).25
- EVs are driving demand for lithium, which is expected to increase by a factor of 12.6 between 2021 and 2040 based on announced pledges. This necessitates increased global extraction of lithium.34
- Lithium recycling infrastructure could reduce supply chain pressure, but recovery remains challenging due to the lack of battery standardization, limited regulation, and high operational costs.26,27 Currently, less than 5% of lithium-ion batteries are recycled.21
- BEVs generate roughly twice the production phase emissions of ICEVs, largely during battery production.31
- Forecasts show that the production of lithium-ion batteries for EVs could result in 8.1 Gt of CO2e emissions in total by 2050.22
- Adopting EVs would reduce both GHG emissions and energy burden for over 90% of vehicle-owning U.S. households.28
- China and the EU have steadily expanded charging networks in line with EV growth. The U.S. and U.K. have lagged, with the U.S. reaching a ratio of 32 EVs per public charging point in 2024. The global ratio is 11 EVs per public charging point.6
- U.S. demand for EVs is projected to reach 33M by 2030. This would require a national network of 28M charging ports, including 26.8M private and 1.2M public ports.30
Solutions and Sustainable Actions
- On average, new 300-mile range BEVs across the U.S. have 72% lower total life cycle GHG emissions than comparable ICEVs.21
- Switching from an ICEV pickup to a 300-mile range BEV compact reduces total life cycle GHG emissions by 81%.21
- Small and low-range EVs generally have a lower total cost of ownership than their gasoline equivalents. 200-mile range compact and midsize EVs typically break even with gasoline vehicles on total cost of ownership after 3 to 7 years, even without federal incentives.23
- Used BEVs have the lowest total cost of ownership of any used vehicle. Used vehicles are 70% of sales in the U.S.32
- BEVs and PHEVs can be used to power the electrical grid using a process called vehicle-to-grid charging. By using a vehicle-to-grid charging strategy, EVs can produce negative incremental emissions by incentivizing renewable grid energy because wind and solar energy are easier to integrate onto the grid when EVs provide energy storage capacity.24
- The introduction of BEVs will accelerate the existing trend of decreased air pollutant emissions. With (and without) the introduction of BEVs, the emissions of CO, NOx, HC, and PM2.5 from the U.S. LDV fleet are expected to decrease by approximately 77% (61%), 94% (88%), 71% (55%), and 37% (20%), respectively, from 2020 to 2040.25
- All vehicles produce particulates from tires, braking, and the road, with EVs producing similar amounts to ICEVs when regenerative braking is not considered. Particulate matter decreases with regenerative braking.26,27
Lifetime GHG Emissions for Each Vehicle Class and Powertrain Combination Averaged Across the U.S. (g CO2e/mi)31
See vehicle-emissions-calculator.vercel.app/ to compare emissions by vehicle, powertrain, and county.
- GHG emissions from driving EVs are dependent on charging location (temperature, grid fuel mix, etc.).31
- To maximize battery life, BEV owners should minimize time spent at 100% or 0% state of charge, and limit use of fast charging. Level 2 charging reduces battery degradation.33
- 25–37% of vehicles could meet all their driver's trip needs using a smaller BEV paired with public charging.35
- By 2050 ZEVs combined with clean power grids could lead to $978B in public health benefits, prevent 89,300 premature deaths, 2.2M asthma attacks, and 10.7M lost work days.38
Cite As
Center for Sustainable Systems, University of Michigan, Ann Arbor. 2026. "Electric Vehicles Factsheet." Pub. No. CSS23-08.
References
- U.S. Department of Energy (DOE) Electric Vehicles. https://afdc.energy.gov/vehicles/electric
- U.S. Energy Information Administration (EIA) (2023) Use of energy explained Energy use for transportation Electric Vehicles. https://www.eia.gov/energyexplained/use-of-energy/transportation-in-depth.php
- U.S. DOE, U.S. Environmental Protection Agency (EPA) All-Electric Vehicles. https://fueleconomy.gov/feg/evtech.shtml
- U.S. DOE Fuel Cell Electric Vehicles. https://afdc.energy.gov/vehicles/fuel-cell#:~:text=Fuel%20cell%20electric%20vehicles%20(FCEVs,water%20vapor%20and%20warm%20air.
- U.S. DOE How Do All-Electric Cars Work?. https://afdc.energy.gov/vehicles/how-do-all-electric-cars-work
- International Energy Agency (IEA) (2025) Global EV outlook 2025. https://www.iea.org/reports/global-ev-outlook-2025
- U.S. Department of Transportation (DOT) (2023) Charger Types and Speeds. https://www.transportation.gov/rural/ev/toolkit/ev-basics/charging-speeds
- U.S. Department of Energy (DOE) Oak Ridge National Laboratory (ORNL) and U.S. Environmental Protection Agency (EPA) (2026) Electric Vehicles. https://www.fueleconomy.gov/feg/PowerSearch.do?action=noform&vtype=Electric&srchtyp=evSelect&rowLimit=200&sortBy=Rng&year1=2025&year2=2026&range=100&drive=&tabView=0&tabView=0&pageno=1
- Argonne National Lab Light Durty Electric Drive Vehicles Monthly Sales Updates. https://www.anl.gov/esia/light-duty-electric-drive-vehicles-monthly-sales-updates
- Argonne National Laboratory (ANL) (2025) LDV Total Sales of PEV and HEV by Month (updated through May 2025). https://www.anl.gov/esia/reference/light-duty-electric-drive-vehicles-monthly-sales-updates-historical-data
- Electrification Coalition (2025) EV and Charging Tax Credits After the One Big Beautiful Bill Act. https://electrificationcoalition.org/resource/ev-and-charging-tax-credits-after-the-one-big-beautiful-bill-act/
- Alternative Fueling Station Locator May 1 2026. https://evchargingstations.com/chargingnews/largest-dc-fast-charging-networks-us-march-2026/
- Chase (2025) Making the Transition to an Electric Vehicle. https://autofinance.chase.com/electric-vehicles/home
- CARB (2022) California moves to accelerate to 100% new zero-emission vehicle sales by 2035. https://ww2.arb.ca.gov/news/california-moves-accelerate-100-new-zero-emission-vehicle-sales-2035
- ICCT (2024) ELECTRIC VEHICLE MARKET AND POLICY DEVELOPMENTS IN U.S. STATES, 2023. https://theicct.org/wp-content/uploads/2024/05/ID-154-%E2%80%93-U.S.-EVs_final.pdf
- U.S. DOE (2022) Electric Vehicle (EV) and Fuel Cell Electric Vehicle (FCEV) Tax Credit. https://afdc.energy.gov/laws/409
- Shepardson, D. (2026) US sues California over zero emission vehicle, greenhouse gas rules. Reuters, https://www.reuters.com/world/us-sues-california-over-zero-emission-vehicle-greenhouse-gas-rules-2026-03-12/
- Library of Congress (2025) Status of Federal Implementation of EV Charging Infrastructure. https://www.congress.gov/crs-product/IN12556
- United States District Court Western District of Washington at Seatle (2025) Order on Motion for Preliminary Injunction. https://www.sierraclub.org/sites/default/files/2025-06/2025-06-24-pi-order-1.pdf
- U.S. Department of Transportation (2025) President Trump Transportation Secretary Sean Duffy Unveils Revised NEVI Guidance to Allow States to Actually Build EV Chargers. https://www.transportation.gov/briefing-room/president-trumps-transportation-secretary-sean-p-duffy-unveils-revised-nevi-guidance
- Sheth, R.P. et al. (2023) The Lithium-Ion Battery Recycling Process from a Circular Economy Perspective—A Review and Future Directions. Energies, https://doi.org/10.3390/en16073228
- Llamas-Orozco, J.A. et al. (2023) Estimating the Environmental Impacts of Global Lithium-ion Battery Supply Chain: A temporal, geographical, and technological perspective. https://doi.org/10.1093/pnasnexus/pgad361
- Woody, M. et al. (2024) Electric and Gasoline Vehicle TCO Across US Cities. Journal of Industrial Ecology, https://doi.org/10.1111%2Fjiec.13463
- Jiahui Chen, Michael T. Craig, Jeremy Michalek, Matthew Bruchon, Parth Vaishnav; Negative Electric Vehicle Emissions: Vehicle-to-Grid Can Incentivize Enough Wind and Solar Investment to Reverse EV Charging Emissions. Environ. Sci. Technol. 7 October 2025; 59 (39): 21090–21101. https://doi.org/10.1021/acs.est.5c06944
- Rachael H. Dolan, Timothy J. Wallington, James E. Anderson; Large Decreases in Tailpipe Criteria Pollutant Emissions from the U.S. Light-Duty Vehicle Fleet Expected in 2020–2040. Environ. Sci. Technol. 20 February 2024; 58 (7): 3205–3212. https://doi.org/10.1021/acs.est.3c04554
- Siriel SaladinAdam BoiesChiara Giorio; Airborne Tire Wear Particles: A Critical Reanalysis of the Literature Reveals Emission Factors Lower than Expected. Environ. Sci. Technol. Lett. 10 December 2024; 11 (12): 1296–1307. https://doi.org/10.1021/acs.estlett.4c00792
- Liu, Y. et al. (2021) Comparative Analysis of Non-Exhaust Airborne Particles from Electric and Internal Combustion Engine Vehicles. Journal of Hazardous Materials, https://doi.org/10.1016/j.jhazmat.2021.126626
- Vega-Perkins, J., et al. (2023) Mapping electric vehicle impacts: greenhouse gas emissions, fuel costs, and energy justice in the United States. https://iopscience.iop.org/article/10.1088/1748-9326/aca4e6
- not used
- NREL (2023) The 2030 National Charging Network: Estimating U.S. Light-Duty Demand for Electric Vehicle Charging Infrastructure. https://docs.nlr.gov/docs/fy23osti/85654.pdf
- Woody, M., et al. (2022) Corrigendum: The role of pickup truck electrification in the decarbonization of light-duty vehicles. https://iopscience.iop.org/article/10.1088/1748-9326/ac7cfc
- not used
- Woody, M. (2020) Strategies to limit degradation and maximize Li-ion battery service lifetime - critical review and guidance for stakeholders. https://deepblue.lib.umich.edu/items/a899538e-03f7-41f4-9d1d-b36259c2a121
- not used
- Kempton, W., et al. (2023) Influence of Battery Energy, Charging Power, and Charging Locations upon EVs’ Ability to Meet Trip Needs. https://www.mdpi.com/1996-1073/16/5/2104
- Fuel Economy, Mercedes GLC350e. https://www.fueleconomy.gov/feg/Find.do?action=sbs&id=48674
- Fuel Economy, Mazda CX-70. https://www.fueleconomy.gov/feg/Find.do?action=sbs&id=48672
- American Lung Association (2023) Driving to Clean Air: Health Benefits of Zero-Emission Cars and Electricity. https://www.fueleconomy.gov/feg/Find.do?action=sbs&id=48674