Plastic Waste Factsheet
Due to plastics’ design potential, diversity, flexibility, low cost, and durability, their use now exceeds most other man-made materials across nearly all industrial sectors. Plastics have enabled tremendous product and technological advances, providing many societal benefits. The high performance-to-weight ratio of plastics relative to alternatives has reduced environmental footprints across the life cycles of key sectors including transportation and food delivery. Despite their material value, plastics often end up landfilled at end-of-life (EoL) and are a major source of marine litter. Plastic leakage from the economy results from low-cost virgin plastic feedstocks and recycling challenges with resin combinations, additives, and contaminated plastics. Design and reuse strategies, along with policy instruments such as recycled content standards, virgin resin taxes, and tradable permits, are needed to increase plastic product service life and circularity. Impact investing is also needed for plastic waste reduction innovation and commercialization, with sustainability criteria guiding investment to avoid greenwashing.1,2
Table of Plastic Definitions
Patterns of Use
- Global plastic use grew from 20 Mt in 1966 to 460 Mt in 2019 and is estimated to reach 1,231 Mt by 2060.6,7 By 2060, the amount of LDPE and LLDPE used in packaging will triple, while PP, HDPE, and PET will more than double.6
- North America has the highest annual per capita plastic use at 139 kg (excluding fiber and rubber polymers), representing 19% of global production and 21% of use.1
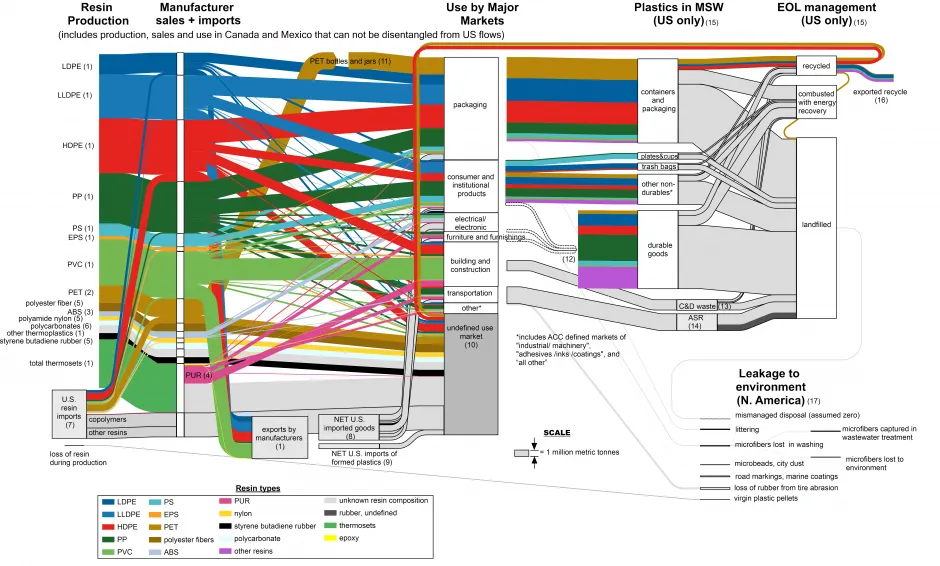
- One-third of plastics in the U.S. were used for packaging in 2017. Two-thirds went into other uses with varying lifetimes: short (disposable serviceware, trash bags, diapers), medium (clothing, tools, electronics, furniture), and long (large appliances, automobiles, buildings).1
Plastic Production, Use, Disposal and Leakage in the US, 20171
- About 30% of all plastics ever made globally remain in use, while 60% are in landfills or loose in the environment.1,2
- Building and construction accounted for 12% of U.S. plastics in 2017, primarily PVC and HDPE for piping, house wraps, siding, trim and window framing, and plastic-wood composites, as well as PUR used as insulation. Recovery at EoL is challenging because demolition produces mixed waste with low plastic fractions, and PVC and PUR thermosets cannot be recycled easily.1
- The transportation sector used over 4% of U.S. plastics in 2017, primarily in vehicle production. Plastic content in North American light vehicles reached 8.6% of material weight in 2017. The variety of automotive plastics and the cost of collection, separation, and cleaning (often exceeding virgin material cost) result in most being landfilled.1
- Electronic waste (e-waste) is growing by 3–4% annually. An estimated 2.6 Mt consumer electronics appeared in U.S. MSW in 2017, with 20-33% plastic content. If efficient and cost-effective recovery methods are available, up to 2.5 Mt of polycarbonates can be recovered from global e-waste yearly.1
Environmental Impacts
- Over 99% of global plastic resin is derived from fossil-based feedstocks. Production, including feedstock and manufacturing energy requirements, represents 8% of global annual oil and gas use.1,7
- Projections based on current growth rates indicate that life-cycle GHG emissions from plastics could reach 15% of the global carbon budget by 2050.9
- The U.S. produced more plastic waste than any other nation in 2016, 42 Mt total and 130 kg per capita annually.7
- In 2019, 86% of plastic waste managed as MSW in the U.S. went to landfill. This landfilled plastic had an average market value of $7.2B. Only 5% of plastic waste was recycled and 9% was combusted.10
- In 2019, 9% of global plastic waste was recycled, 19% was incinerated, about 50% was sent to sanitary landfills, and 22% was openly burned, sent to unsanitary dumpsites, or leaked into the environment.6
- Rapidly developing middle-income countries in Asia with inadequate collection systems are responsible for an estimated 80% of global leakage. The U.S. and Europe, despite having advanced collection systems, leak 170,000 t of plastics into oceans annually.11
- The flow of plastic into the ocean is projected to nearly triple by 2040. Without considerable action, 50 kg of plastic will enter the ocean per meter of shoreline.12
- Ocean plastic pollution impacts over 800 marine species, affecting all sea turtle species, 40% of cetacean species, and 44% of marine bird species.12
Plastic Materials Management of U.S. MSW28
- Plastic bottles and disposable diapers take over 450 years to biodegrade in oceans.13
- If current practices continue, by 2050, there could be more plastic than fish in the ocean by weight.14
Solutions and Sustainable Actions
- The UN’s Intergovernmental Negotiating Committee, with 175 nations, has committed to signing a globally binding plastics agreement.15 In August 2025, the fifth negotiating session (INC-5.2) in Geneva was held with 183 countries and over 400 organizations.24
- Over 1,000 organizations worldwide, including businesses representing 20% of global plastic packaging production and over 50 government signatories, mobilized the Global Commitment mission for a circular economy where plastic never becomes waste,23 avoiding 9.6 Mt of virgin plastic since 2018, equivalent to 1T single-use plastic bags.23
- U.S. EPA created a National Strategy to Prevent Plastic Pollution with three key objectives: reducing pollution during production, improving post-use materials management, and preventing trash and micro/nanoplastics from entering the environment.16
Circular Plastics Economy25,26,27
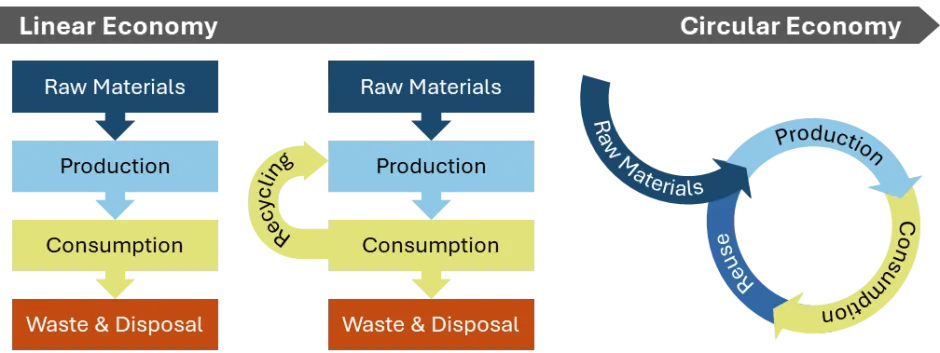
- A circular economy for plastics is one in which plastic remains in service and maintains its material value,17 with reuse as a key strategy.1
- By 2040, a circular economy could achieve an 80% reduction in ocean plastic volume, a 25% reduction in GHG emissions, $200B in annual savings, and create 700,000 jobs.18
- Redesigning products for recyclability increases circularity. For example, using thermoplastic instead of thermoset resin makes wind turbine blades recyclable.11,20
- Effective policy instruments include command-and-control measures (take-back mandates, disposal bans, product/material bans, recycled content standards) and market-based approaches (disposal fees, deposit-refund systems, pay-as-you-throw programs, taxes, tradable permits).1
- Targeted taxes can reduce consumption. Ireland’s €0.15 plastic bag tax (raised to €0.22 in 2006) immediately reduced bag use by 90%.22
- Some evidence suggests that price instruments like levies and producer responsibility schemes do more to generate revenue than reduce demand. Fiscal policies need combination with bans on single-use plastics and hazardous additives and polymers.25
- The 10 recycling refund states, representing 27% of the U.S. population, account for 47% of all packaging recycled and 51% of beverage containers recycled.21
- Combustion and pyrolysis solutions for energy recovery and fuels can address plastic waste but are problematic with regard to carbon emissions.1
U.S. Beverage Container Recycling Rates21,29
Center for Sustainable Systems, University of Michigan. 2025. "Plastic Waste Factsheet." Pub. No. CSS22-11.
References
1. Heller, M., et al. (2020) “Plastics in the US: Toward a Material Flow Characterization of Production, Markets and End of Life.” Environmental Research Letters 15 (9), 094034.
https://iopscience.iop.org/article/10.1088/1748-9326/ab9e1e/pdf
2. "Keoleian, G., et al. (2022) A Tool for Evaluating Environmental Sustainability of Plastic Waste Reduction Innovations CSS21-11."
3. Ashter, S. (2016) Introduction to Bioplastics Engineering.
https://www.sciencedirect.com/science/article/pii/B9780323393966000014
4. "Thompson, R. (2017) ""Future of the sea: plastic pollution."" UK Government Office for Science."
5. National Oceanic and Atmospheric Administration (NOAA) “Microplastics Diving Deeper: Episode 66- Transcript.”
https://oceanservice.noaa.gov/podcast/june16/dd66-microplastics.html
6. Organization for Economic Cooperation and Development (OECD) (2022) Global Plastics Outlook: Policy Scenarios to 2060.
https://www.oecd.org/publications/global-plastics-outlook-aa1edf33-en.htm
7. The National Academies of Sciences, Engineering, and Medicine (2022) Reckoning with the U.S. Role in Global Ocean Plastic Waste.
https://nap.nationalacademies.org/read/26132/chapter/4#33
8. American Chemistry Council (2020) Plastics and Polymer Composites in Light Vehicles.
9. Zheng, J. & S. Suh (2019) Strategies to reduce the global carbon footprint of plastics.
https://www.nature.com/articles/s41558-019-0459-z
10. U.S. Environmental Protection Agency (EPA) (2021) “Plastics: Material-Specific Data.”
10. Milbrandt, A., et al. (2022) Quantification and evaluation of plastic waste in the United States. National Renewable Energy Laboratory (NREL).
https://www.sciencedirect.com/science/article/pii/S0921344922002087?via%3Dihub
11. World Economic Forum Ellen MacArthur Foundation and McKinsey & Company (2016) The New Plastics Economy - Rethinking the future of plastics & catalysing action.
12. "The Pew Charitable Trusts (2020) Breaking the Plastic Wave."
https://www.pewtrusts.org/-/media/assets/2020/07/breakingtheplasticwave_report.pdf
13. World Economic Forum (2018) This is how long everyday plastic items last in the ocean.
14. "WEF Ellen MacArthur Foundation and McKinsey & Company (2016) The New Plastics Economy - Rethinking the future of plastics. "
https://ellenmacarthurfoundation.org/the-new-plastics-economy-rethinking-the-future-of-plastics
15. UNEP (2024) Pivotal fourth session of negotiations on a global plastics treaty opens in Ottawa.
16. U.S. EPA (2023) "Draft National Strategy to Prevent Plastic Pollution."
https://www.epa.gov/circulareconomy/draft-national-strategy-prevent-plastic-pollution
17. "Ellen MacArthur Foundation “Plastics and the Circular Economy.” Accessed June 2022."
https://archive.ellenmacarthurfoundation.org/explore/plastics-and-the-circular-economy
18. "Ellen MacArthur Foundation “Designing out Plastic Pollution.” Accessed June 2022."
https://ellenmacarthurfoundation.org/topics/plastics/overview
20. NREL (2020) “Greening Industry: Building Recyclable, Next-Generation Turbine Blades.”
https://www.nrel.gov/news/program/2020/greening-industry.html
21. Eunomia (2023) The 50 State of Recycling.
https://www.ball.com/getmedia/dffa01b0-3b52-4b90-a107-541ece7ee07c/50-STATES_2023-V14.pdf
22. National Conference of State Legislatures (NCSL) (2020) “State Beverage Container Deposit Laws.”
https://www.ncsl.org/research/environment-and-natural-resources/state-beverage-container-laws.aspx
22. "OECD “OECD ocean - taxes on single-use plastics.” Accessed June 2022."
https://www.oecd.org/stories/ocean/taxes-on-single-use-plastics-186a058b
23. Ellen MacArthur Foundation (2024) The Global Commitment 2024 Progress Report
24. UNEP (2025) Press Releasse - Talks on global plastic pollution treaty adjourn without consensus
https://www.unep.org/inc-plastic-pollution/media#PressRelease15Aug
25. UNEP, ISWA (2024) Global Waste Management Outlook 2024
26. Weidner, E., Pflaum, H. (2025). What is Circular Plastics Economy?. In: Buettner, A., Weidner, E. (eds) Springer Handbook of Circular Plastics Economy. Springer Handbooks. Springer, Cham
https://doi.org/10.1007/978-3-031-66209-6_1
27. KAIZEN (2025) Circular Economy in Chemical and Plastic Industry
https://kaizen.com/insights/circular-economy-chemical-plastic
28. U.S. Environmental Protection Agency (EPA) (2021) “Plastics: Material-Specific Data.”
29. National Conference of State Legislatures (NCSL) (2020) “State Beverage Container Deposit Laws.”
https://www.ncsl.org/research/environment-and-natural-resources/state-beverage-container-laws.aspx
A. “Thermoplastics.” Science Direct.
https://www.sciencedirect.com/topics/materials-science/thermoplastics
B. “Thermoset Plastics.” Science Direct.
https://www.sciencedirect.com/topics/materials-science/thermoset-plastics
C. “Bioplastics.” Science Direct.
https://www.sciencedirect.com/topics/agricultural-and-biological-sciences/bioplastics
D. “Polymer Composite.” Science Direct.
https://www.sciencedirect.com/topics/materials-science/polymer-composite
E. “Reinforced Plastics/Composites.” Science Direct. https://www.sciencedirect.com/topics/engineering/reinforced-plastics-composites
F. Yang, Y., et al. (2012) “Recycling of composite materials.” Chemical Engineering and Processing: Process Intensification, Vol. 51.