U.S. Water Supply and Distribution Factsheet
All life on Earth depends on water. Human uses include drinking, bathing, crop irrigation, electricity generation, and industrial activity. For some uses, water requires treatment beforehand. Over the last century, water treatment goals have remained consistent: producing water that is biologically and chemically safe, appealing to consumers, and non-corrosive and non-scaling. Water supply problems and solutions vary significantly by region. Failure by governments to enforce drinking water regulations and promptly protect public health resulted in lead contamination and cases of Legionnaires’ disease in Flint, MI.1 The arid southwest faces droughts, and decreasing water levels at the U.S.’s largest reservoirs, Lake Powell and Lake Mead, are impacting hydropower production.2 In marine systems like south Florida, increased freshwater use has created the need for desalination plants.3
Patterns of Use
- In 2015, U.S. water use was approximately 322B gal/d, 87% of which was freshwater.4 Thermoelectric power plant cooling (133B gal/d) and irrigation (118B gal/d) were the largest withdrawals.4 Between 2005 and 2015 U.S. water use decreased by 21.5%, mainly due to a 33.8% reduction in thermoelectric power withdrawals,29 then grew more than 7.5% from 2000-2020.30 Though 41% of daily water use is for power plant cooling, only 3% of these withdrawals are consumptive.4 Irrigation includes water for agricultural crops and water used for landscaping, golf courses, parks, etc.4
- In 2015, California and Texas accounted for 16% of U.S. water withdrawals.4 These states along with Idaho, Florida, Arkansas, New York, Illinois, Colorado, North Carolina, Michigan, Montana, and Nebraska account for more than 50% of U.S. withdrawals.4 Florida, New York, and Maryland accounted for 50% of saline water withdrawals.4
Estimated Use of Water (Billion Gallons per Day), 20154
Sources of Water
- Surface sources account for 74% of all water withdrawals.4
- Approximately 87% of the U.S. population relied on public water supply in 2015; the remainder relied on water from domestic wells.4
- Approximately 145,393 publicly owned water systems provide piped water for human consumption in 2025, of which 34% are community water systems (CWS).5 Of all CWSs, 9% provide water to 84% of the population.5
- In 2006, CWSs delivered an average of 96,000 gal/yr to each residential connection and 797,000 gal/yr to non-residential connections.6
- Nearly all rural populations rely on groundwater for drinking water.7 Over 84B gal of groundwater is withdrawn in the U.S. every day, nearly 70% is for irrigation.4
Withdrawals by Source (%)4
Energy Use
- 2% of U.S. electricity use goes towards pumping and treating water and wastewater, a 52% increase since 1996.8 Electricity accounts for around 80% of municipal water processing and distribution costs.9
- Groundwater supply from public sources requires 2,100 kWh/M gal, about 31% more electricity than surface water supply, mainly due to greater water pumping requirements.8
- The California State Water Project is the state’s largest single energy use: 6-9.5B kWh/yr, partially met by its own hydroelectric generation.10
- Delivering water from the San Francisco Bay-Delta to Southern CA uses 3-4% of all state electricity.11 19% of CA’s electricity use is for pumping, treating, collecting, and discharging water and wastewater.9
Water Treatment
- The UN 6th Sustainable Development Goal aims to ensure access to clean water for all. Clean water and sound water resource management are essential for a sustainable future.12
- The Safe Drinking Water Act (SDWA), enacted in 1974 and amended in 1986, 1996, and 2018, regulates contaminants in public water supplies, provides infrastructure funding, protects drinking water sources, and promotes water system compliance capacity.13
- The U.S. EPA monitors drinking water for microorganisms, disinfectants, radionuclides, and organic and inorganic compounds.14
Size Categories of Community Water Systems5
- 91% of CWSs are designed to disinfect water, 23% to remove or sequester iron, 13% to remove or sequester manganese, and 21% for corrosion control.14
- Use the Municipal Drinking Water Database to learn more about the drinking water systems of over 2,000 U.S. cities and the communities that they serve.15
Life Cycle Impacts
Infrastructure Requirements
- The 2023 Drinking Water Infrastructure Needs Survey and Assessment found that U.S. water systems need $625B of investment by 2041 to maintain clean drinking water supply.16
- Water systems maintain more than 2M miles of transmission and distribution mains.30 In 2020, the average age of U.S. water pipes was 45 years, up from 25 years in 1970.18
- From 2004-2017, ≈ 250,000 main breaks occurred annually, disrupting supply and risking contamination of drinking water.19 Since 2018, water main breaks have decreased 20% annually, largely due to replacement of cast iron and asbestos cement pipes (which have the highest breakage rates).30 Aging infrastructure contributes significantly to water loss; 33.3T gal (worth $187B) is lost annually.30
- There are an estimated 9.2M lead service lines in the U.S.20 In 2021, Congress passed the Bipartisan Infrastructure Law (BIL) allocating $15B towards lead service line replacement.16
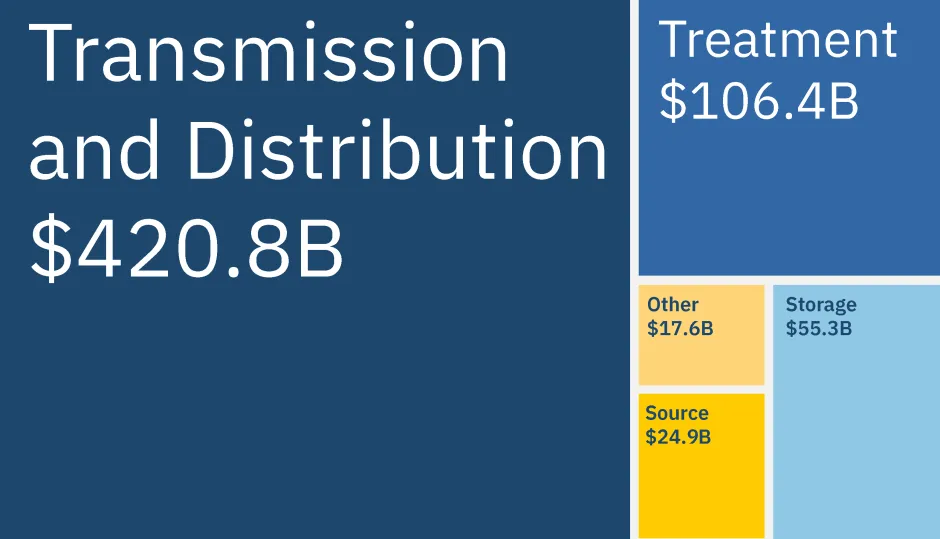
Water System Need by 2041, ($) by Project Type16
Consumptive Use
- Consumptive water use draws water from a source within a basin and returns none or only a portion back.4
- Agriculture is responsible for 80-90% of total U.S. consumptive water use.21 Of the 118B gal/d of freshwater withdrawn for irrigation, over half is lost to consumptive use.4
- Over the past 50 years, water consumption has tripled.22
Solutions and Sustainable Alternatives
Supply Side
- Continued federal funding through the Infrastructure Investment and Jobs Act will reduce the infrastructure investment gap and decrease service disruptions to water-reliant businesses, resulting in 46% cost savings and preserving over 200,000 jobs by 2043.31
- Periodic rehabilitation, repair, and replacement of distribution infrastructure would improve water quality and avoid leaks.17 Right-sizing, upgrading to energy efficient equipment, and monitoring and control systems can optimize systems for the communities they serve, while saving energy and water.9
- Significant energy efficiency opportunities exist for pumps and motors.23 Implementing on-site energy and chemical use efficiency measures, including sludge recycling and chemical recovery, reduces environmental impacts and chemical use.
- Effective watershed management is often more efficient than treating contaminated water. NYC invested $1-1.5B in a watershed protection project to improve the water quality in the Catskill watershed rather than constructing a new $6-8B filtration plant.24 Over 25 years, the Watershed Protection Program has improved water quality with strong indications of continued effectiveness.32
- Less than 4% of U.S. freshwater comes from brackish or saltwater. Desalination technology, such as reverse osmosis membrane filtering, unlocks large resources, but improvements are needed to lower costs, energy use, and environmental impacts.8
Demand Side
- Better engineering practices: plumbing fixtures to reduce water consumption (high-efficiency toilets, low-flow showerheads, and faucet aerators); water reuse and recycling (graywater systems and rain barrels); efficient landscape irrigation practices.27,33
- Better planning and management: pricing and retrofit programs; proper leak detection and metering; residential water audit programs and public education programs.27,33
- Communities experiencing environmental injustice can use environmental justice toolkits, such as the Water Justice Toolkit.28
Center for Sustainable Systems, University of Michigan. 2025. "U.S. Water Supply and Distribution Factsheet." Pub. No. CSS05-17.
References
- Flint Water Advisory Task Force (2016) Final Report. https://www.michigan.gov/-/media/Project/Websites/formergovernors/Folder6/FWATF_FINAL_REPORT_21March2016.pdf?rev=284b9e42c7c840019109eb73aaeedb68
- Udall, B., J. Overpeck (2017) The twenty-first century Colorado River hot drought and implications for the future. https://agupubs.onlinelibrary.wiley.com/doi/full/10.1002/2016WR019638
- South Florida Water Management District (2021) "Desalination." https://www.sfwmd.gov/our-work/alternative-water-supply/desalination
- Dieter, C., et al. (2018) Estimated use of water in the United States in 2015. U.S. Geological Survey Circular 1441. https://pubs.usgs.gov/circ/1441/circ1441.pdf
- U.S. Environmental Protection Agency (EPA) (2025) Government Performance and Results Act (GPRA) Inventory Summary Report. https://obipublic.epa.gov/analytics/saw.dll?PortalPages&PortalPath=/shared/SFDW/_portal/Public&Page=Inventory
- U.S. EPA (2009) 2006 Community Water System Survey. http://water.epa.gov/infrastructure/drinkingwater/pws/cwssvr.cfm
- USGS (2018) Groundwater Decline and Depletion https://www.usgs.gov/special-topics/water-science-school/science/groundwater-decline-and-depletion
- Electric Power Research Institute (2013) Electricity Use and Management in the Municipal Water Supply and Wastewater Industries. https://www.epri.com/research/products/000000003002001433
- Congressional Research Service (2017) "Energy-Water Nexus: The Water Sector's Energy Use." https://fas.org/sgp/crs/misc/R43200.pdf
- California Department of Water Resources (2020) Producing and Consuming Power. https://water.ca.gov/What-We-Do/Power#:~:text=As%20the%20largest%20single%20consumer,the%20water%20throughout%20the%20State.
- California Energy Commission (2020) Water-Energy Bank. https://www.energy.ca.gov/sites/default/files/2021-05/CEC-500-2020-006.pdf
- UN Environmental Programme (2024) GOAL 6: Clean Water and Sanitation https://sdgs.unep.org/article/goal-6
- Congressional Research Service (2021) Safe Drinking Water Act (SDWA) A Summary of the Act and Its Major Requirements. https://www.fas.org/sgp/crs/misc/RL31243.pdf
- U.S. EPA (2021) “National Primary Drinking Water Regulations.” https://www.epa.gov/ground-water-and-drinking-water/table-regulated-drinking-water-contaminants
- Hughes, Sara; Kirchhoff, Christine; Conedera, Katelynn; Friedman, Mirit, 2023, "The Municipal Drinking Water Database, 2000-2018 [United States]", https://doi.org/10.7910/DVN/DFB6NG, Harvard Dataverse, V2. https://dataverse.harvard.edu/dataset.xhtml?persistentId=doi:10.7910/DVN/DFB6NG
- US EPA (2023) Drinking Water Infrastructure Needs Survey and Assessment – Seventh Factsheet. https://www.epa.gov/dwsrf
- US EPA (2018) Drinking Water Infrastructure Needs Survey and Assessment – Sixth Report. https://www.epa.gov/sites/production/files/2018-10/documents/corrected_sixth_drinking_water_infrastructure_needs_survey_and_assessment.pdf
- Water Finance and Management (2017) "Bluefield: CAPEX for Pipe Suppliers to Hit $300 Billion Over Next Decade." https://waterfm.com/bluefield-capex-pipe-suppliers-hit-300-billion-next-decade/
- American Society of Civil Engineers (2021) 2021 Report Card For Americas Infrastructure. https://infrastructurereportcard.org/
- US EPA (2023) One-time Update to the 7th DWINSA Lead Service Line Questionnaire https://www.epa.gov/system/files/documents/2023-09/One%20Time%20LSL%20update%20DWINSA_FACTSHEET_Final.pdf
- The National Agricultural Law Center (2013) “Water Law: An Overview.” https://nationalaglawcenter.org/overview/water-law/
- EPA (2023) Water Conservation at EPA. https://www.epa.gov/greeningepa/water-management-epa
- U.S. EPA (2013) Strategies for Saving Energy at Public Water Systems. https://www.epa.gov/sites/default/files/2015-04/documents/epa816f13004.pdf
- Chichilnisky, G. and G. Heal (1998) Economic returns from the biosphere. Nature, 391: 629-630. http://www.nature.com/nature/journal/v391/n6668/pdf/391629a0.pdf
- U.S. EPA (2024) Sustainable Water Infrustruture https://www.epa.gov/sustainable-water-infrastructure
- U.S. EPA (2017) Simple Steps to Save Water - WaterSense https://19january2017snapshot.epa.gov/www3/watersense/pubs/simple_steps.html
- U.S. EPA (2020) “Water Management Plans and Best Practices at EPA.” https://www.epa.gov/greeningepa/water-management-plans-and-best-practices-epa
- American Rivers (2021) Water Justice Toolkit: A Guide to Address Environmental Inequities in Frontline Communities https://www.americanrivers.org/wp-content/uploads/2021/06/20210628-Lapham-Water-Justice-Toolkit.pdf
- Kelly, J., et al. (2009) Estimated Use of Water in the United States in 2005 https://pubs.usgs.gov/circ/1344/pdf/c1344.pdf
- American Society of Civil Engineer (2025) 2025 Infrastructure Report Card - Drinking Water https://infrastructurereportcard.org/wp-content/uploads/2025/03/Drinking-Water.pdf
- ASCE (2024) Bridging the Gap: The Power of Investment in Water https://uswateralliance.org/wp-content/uploads/2024/05/Bridging-the-Gap—The-Economic-Benefits-of-Investing-in-Water.pdf
- National Academies of Sciences, Engineering, and Medicine; Division on Earth and Life Studies; Water Science and Technology Board; Committee to Review the New York City Watershed Protection Program. Review of the New York City Watershed Protection Program. Washington (DC): National Academies Press (US); 2020 Aug 10. https://www.ncbi.nlm.nih.gov/books/NBK566278
- U.S. EPA (2013) Strategies for Saving Water at Public Water Systems https://www.epa.gov/sites/default/files/2015-04/documents/epa816f13004.pdf