U.S. Wastewater Treatment Factsheet
Patterns of Use
For many years, humans have treated wastewater to protect human and ecological health from waterborne diseases. Since the early 1970s, effluent water quality has been improved at Publicly Owned Treatment Works (POTWs) and other point source discharges through major public and private investments prescribed by the Clean Water Act (CWA). Despite the improvement in effluent quality, point source discharges continue to be a significant contributor to the degradation of surface water quality. In addition, much of the existing wastewater infrastructure, including collection systems, treatment plants, and equipment, has deteriorated and is in need of repair or replacement.
Contamination and Impacts
- Pollutants contaminate receiving water via many pathways: point sources, non-point sources (e.g., air deposition, agriculture), sanitary sewer overflows, stormwater runoff, combined sewer overflows, and hydrologic modifications (e.g., channelization and dredging).
- In the U.S., 58% of river and stream miles, 40% of lake acres, 17% of estuarine square miles, and 23% of Great Lakes shoreline miles that have been assessed by the U.S. EPA have excess nutrients.2
- Excess nutrients can come from agriculture, urban runoff, and wastewater treatment and cause water quality problems, such as algal blooms and fish kills.2
- Around 16% of households are not served by public sewers and usually depend on septic systems to treat wastewater.3
- Failing septic systems may contaminate surface and groundwater.4
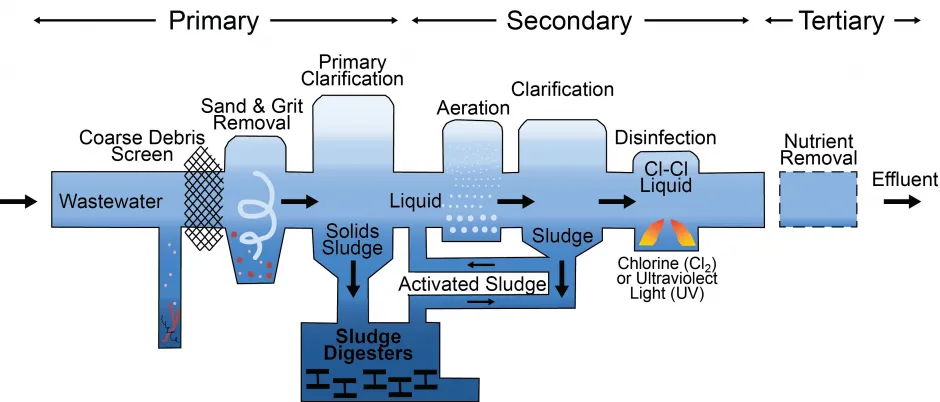
Wastewater Treatment Process1

Treatment of Municipal Wastewater
- An estimated 14,748 POTWs provide wastewater collection, treatment, and disposal service to more than 238 million people.6 Use of reclaimed water for consumption is becoming more common, particularly in regions prone to drought or with growing water demand (such as the U.S. southwest).7
- In 2015, California recycled roughly 714,000 acre-feet of water per year (ac-ft/yr). It has set ambitious goals to increase water recycling, with at least 1.5 million ac-ft/ yr recycled by 2020, and 2.5 million ac-ft/yr by 2030.8
- POTWs generate over 13.8 million U.S. short tons (dry weight) of sludge annually.9 Sludge requires significant energy to treat—about one-third of total electricity use by a wastewater treatment system.10
- In the U.S., chlorination is the most common mean of disinfection. Chlorination may be followed by dechlorination to avoid deteriorating ecological health of the receiving stream and the production of carcinogenic by-products.11
- Ultraviolet (UV) disinfection is an alternative to chlorination that does not add chemicals to the water. However, this method can have higher maintenance, energy and capital costs.12
- Chemical additions of ferric salts and lime enhance coagulation and sedimentation processes for improved solids removal as well as removal of toxic pollutants. However, their production and transport have life cycle impacts.13
- Classes of unregulated compounds known as “contaminants of emerging concern” (CECs) are a concern for water treatment engineers, particularly pharmaceuticals and personal care products.14 Polybrominated diphenyl ethers (PBDEs) and per- and polyfluoroalkyl substances (PFASs) have become CECs due to their wide distribution and persistence in the environment.15 Some of these chemicals are endocrine disruptors, a class of compounds that alter the normal functioning of endocrine systems, including those that affect growth and reproduction.16 Many of these chemicals are not removed by POTWs.17 Currently, researchers are studying the effectiveness of technologies for removing PFAS from drinking water.18
Biosolids (Sludge) End-of-Life
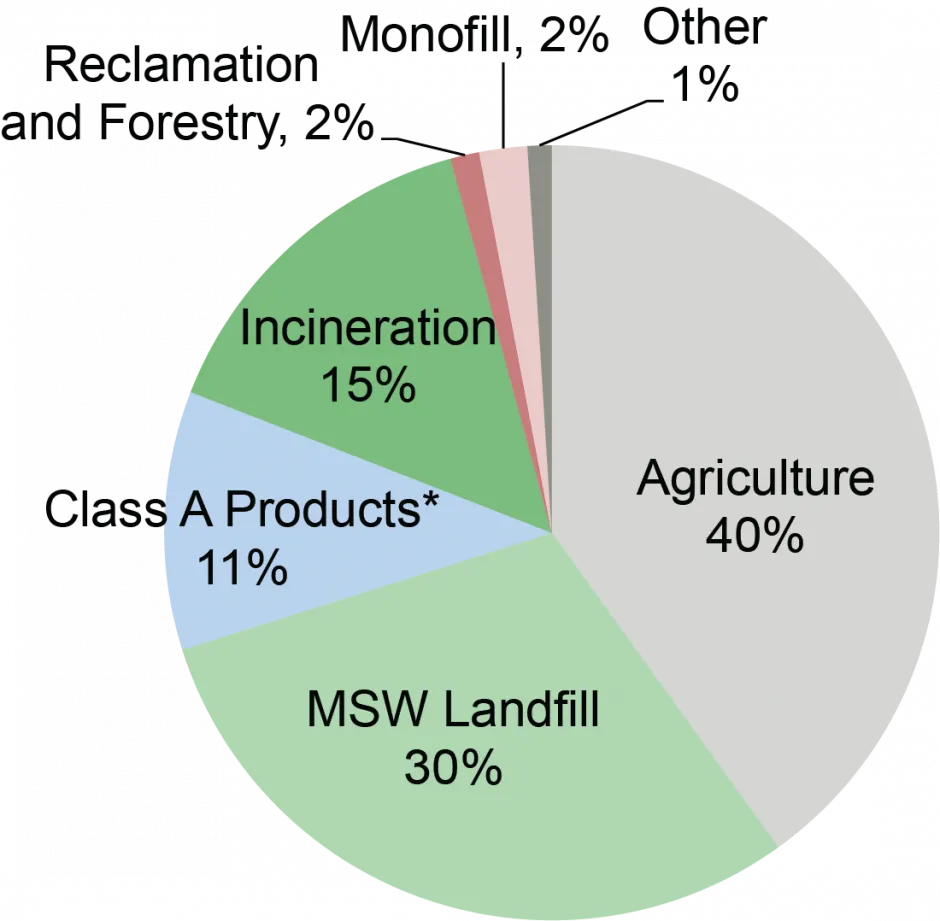
- Qualified biosolids can be beneficially used after “stabilization,” which kills pathogens and decomposes vector-attractive substances.19
- U.S. management practices amount to 54% of biosolids being beneficially used. Most is applied to agricultural sites, with minor amounts applied to forestry and reclamation sites (e.g., Superfund and brownfield lands) and urban areas (e.g., maintaining park land).20
Biosolids Use and Disposal5
*(e.g., treated for horticulture use)

Life Cycle Impacts
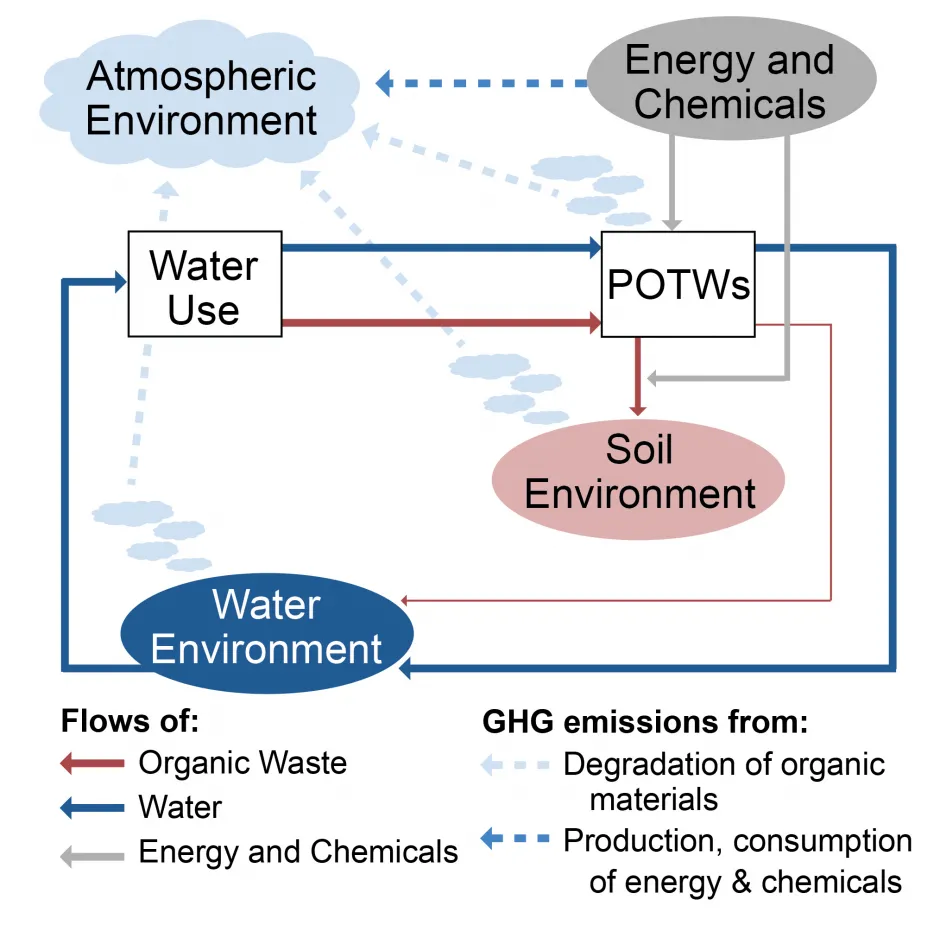
Wastewater treatment systems reduce environmental impacts in the receiving water, but create other life cycle impacts, mainly through energy consumption. Greenhouse gas (GHG) emissions are associated with both the energy and chemicals used in wastewater treatment and the degradation of organic materials in the POTW.
Electricity Consumption and Emissions
- About 2% of U.S. electricity use goes towards pumping and treating water and wastewater.10
- In 2013, energy-related emissions resulting from POTW operations, excluding organic sludge degradation, were 15.5 teragrams (Tg) CO₂-equivalents (CO₂e), 22.3 gigagrams (Gg) SO₂, and 12.7 Gg NOx. SO₂ and NOx contribute to acidification and eutrophication.10,21
- CH₄ and N₂O are emitted during organic sludge degradation by aerobic and anaerobic bacteria in the POTW and receiving water body. In 2021, an estimated 21.1 and 20.9 MMT CO2e of CH4 and N2O, respectively, resulted from wastewater treatment processes, about 0.7% of total U.S. GHG emissions.22
Life Cycle Impact of Wastewater Treatment Systems1

Social and Economic Impacts
- In the U.S., an average single family household pays around $500 annually for wastewater collection and treatment.23
- Population growth and urban sprawl increase the collection (sewer) infrastructure needed.
- Although the lifetime of a sewer system (50 years) is longer than that of treatment equipment (15 to 20 years), renovation needs of a sewer system can be more costly. An EPA analysis estimated that if 600,000 miles of existing sewer systems were not renovated, the amount of deteriorated pipe would increase to 44% of the total network by 2020.24 U.S. costs for building new and updating existing wastewater treatment plants ($102.0 billion), pipe repair and new pipes ($95.7 billion), and combined sewer overflow corrections ($48.0 billion) totalled around $250 billion in 2012.6
Solutions and Sustainable Alternatives
Administrative Strategy
- Investment in wastewater treatment systems is shifting from new construction projects to maintenance of original capacity and function of facilities (asset management). Life cycle costing should be embedded in capital budgeting, and programs for combined sewer overflow, sanitary sewer overflow, and stormwater management need to be permanent.26
- To meet ambient water quality standards, total maximum daily loads (TMDLs) considering both point and non-point source pollutant loadings can be developed. Watershed or waterbody-based management of clean water is expected to facilitate establishment of these TMDLs.27
Reduce Loading
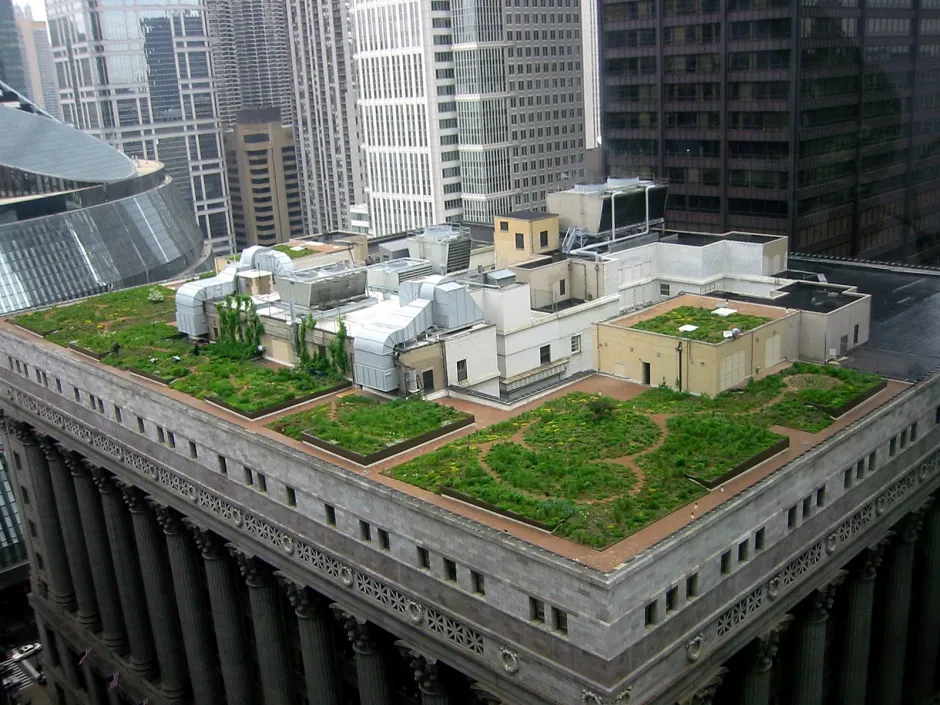
- Examples of projects to reduce or divert wastewater flow include disconnecting household rainwater drainage from sanitary sewers, installing green roofs, and replacing impervious surfaces with porous pavement, swales, or French drains.
- Toilets, showers, and faucets represent 64% of all indoor water use. Install high-efficiency toilets, composting toilets, low-flow shower heads, faucet aerators, and rain barrels. A 2016 survey found that water-efficient appliances contributed to a 22% decline in household water use since 1999.28
- Graywater—wash water from kitchen sinks, tubs and showers, clothes washers, and laundry tubs—can be used for gardening, lawn maintenance, landscaping, and other uses.29
City Hall Green Roof, Chicago, Illinois25

Technological Improvements and System Design
- The aeration process, which facilitates microbial degradation of organic matter, can account for 25% to 60% of the energy use in wastewater treatment plants. Flexible designs allow the system to meet oxygen demands as they fluctuate with time of day and season.30
- Pumping systems, typically consuming 10-15% of energy at wastewater treatment plants, can lead to inefficient energy consumption when pumps, flow control, and motors are mismatched to treatment plant needs.10
- A number of treatment plants are considering using methane generated from anaerobic digestion of biosolids as an energy resource.10
- Water reuse can significantly decrease system energy usage and reduce nutrient loads to waterbodies.31
- Large-scale urine diversion could decrease nutrient loading in wastewater treatment plants and lead to reductions of up to 47% in GHG emission and 41% in energy consumption.32
Center for Sustainable Systems, University of Michigan. 2023. "U.S. Wastewater Treatment Factsheet." Pub. No. CSS04-14.
References
- Adapted from Arkansas Watershed Advisory Group.
- U.S. Environmental Protection Agency (EPA) (2022) “How's My Waterway? Informing the conversation about your waters.”
- U.S. Census Bureau (2022) American Housing Survey 2021 Summary Tables.
- U.S. EPA (2015) “Why Maintain Your Septic System.”
- NEBRA (2022) A National Biosolids Regulation, Quality, End Use & Disposal Survey, 2018 Data.
- U.S. EPA (2016) Clean Watersheds Needs Survey 2012-Report to Congress.
- U.S. EPA (2017) Potable Reuse Compendium.
- California EPA, State Water Resources Control Board (2018) Water Quality Control Policy for Recycled Water.
- Seiple, T., et al. (2017) Municipal Wastewater Sludge as a Sustainable Bioresource in the United States. Journal of Environmental Management, 197: 673-680.
- Electric Power Research Institute (2013) Electricity Use and Management in the Municipal Water Supply and Wastewater Industries.
- U.S. EPA (2004) Primer for Municipal Wastewater Treatment Systems.
- PG&E New Construction Energy Management Program (2006) Energy Baseline Study For Municipal Wastewater Treatment Plants.
- U.S. EPA (2000) Wastewater Technology Factsheet: Chemical Precipitation.
- U.S. EPA (2020) “Contaminants of Emerging Concern including Pharmaceuticals and Personal Care Products.”
- U.S. EPA (2020) “Emerging Contaminants and Federal Facility Contaminants of Concern.”
- U.S. EPA (2021) “Endocrine Disruptor Screening Program (EDSP) Overview.”
- U.S. EPA (2009) Occurrence of Contaminants of Emerging Concern in Wastewater From Nine Publicly Owned Treatment Works.
- U.S. EPA (2022) "Increasing Our Understanding of the Health Risks from PFAS and How to Address Them."
- U.S. EPA (2003) Environmental Regulations and Technology: Control of Pathogens and Vector Attraction in Sewage Sludge.
- National Association of Clean Water Agencies (2010) Renewable Energy Resources: Banking on Biosolids.
- U.S. EPA (2017) eGRID 2014 Summary Tables.
- U.S. EPA (2023) Inventory of U.S. Greenhouse Gas Emissions and Sinks 1990 - 2021.
- American Society of Civil Engineer (2021) 2021 Infrastructure Report Card - Wastewater.
- U.S. EPA (2002) The Clean Water and Drinking Water Infrastructure Gap Analysis.
- Photo by Katrin Scholz-Barth, courtesy of National Renewable Energy Laboratory, NREL-13397.
- U.S. EPA (1998) Cost Accounting and Budgeting for Improved Wastewater Treatment.
- U.S. EPA (2020) “Overview of Total Maximum Daily Loads (TMDLs)”
- Water Research Foundation (2016) Residential End Uses of Water, Version 2 Executive Summary.
- Sharvelle, S., et al. (2012) Long-Term Study on Landscape Irrigation Using Household Graywater. Water Environment Research Fund.
- U.S. EPA (2010) Evaluation of Energy Conservation Measures for Wastewater Treatment Facilities.
- U.S. EPA (2012) 2012 Guidelines for Water Reuse.
- Hilton, S., G. Keoliean, et al. (2020) Life Cycle Assessment of Urine Diversion and Conversion to Fertilizer Products at the City Scale.

