U.S. Wastewater Treatment Factsheet
Patterns of Use
Wastewater treatment protects human and ecological health from waterborne diseases. Since the early 1970s, effluent water quality has improved at Publicly Owned Treatment Works (POTWs) and other point source discharges through major public and private investments prescribed by the Clean Water Act. Despite improved effluent quality, point source discharges continue to contribute to surface water quality degradation. Much existing wastewater infrastructure–collection systems, treatment plants, and equipment–needs repair or replacement.
Contamination and Impacts
- Pollutants contaminate receiving waters through multiple pathways: point sources, non-point sources (air deposition, agriculture), combined sewer overflows (CSOs), sanitary sewer overflows (SSOs), stormwater runoff, and hydrologic modifications (channelization and dredging).
- CSOs are untreated discharges from older combined systems designed to carry both stormwater and sewage. SSOs are untreated sewage discharges from separate collection systems.1
- CSO discharges have decreased over time.2 8.8B gal of untreated wastewater were discharged into Michigan waterways from CSOs in 2021, down from 25B gal in 2011.1
- Inflow and infiltration (I/I) are unintended water entries into sewer systems from surface water sources like rivers and springs and from groundwater through cracks in pipes.2 I/I can account for up to 50% of total sewer system flow, using valuable capacity and causing more frequent overflows.37
- In the U.S., 58% of river and stream miles, 40% of lake acres, 17% of estuarine square miles, and 23% of Great Lakes shoreline miles assessed by the U.S. EPA have excess nutrients.4 These come from agriculture, urban runoff, and wastewater treatment, causing water quality problems, such as algal blooms and fish mortality.4
Municipal Wastewater Tranport3
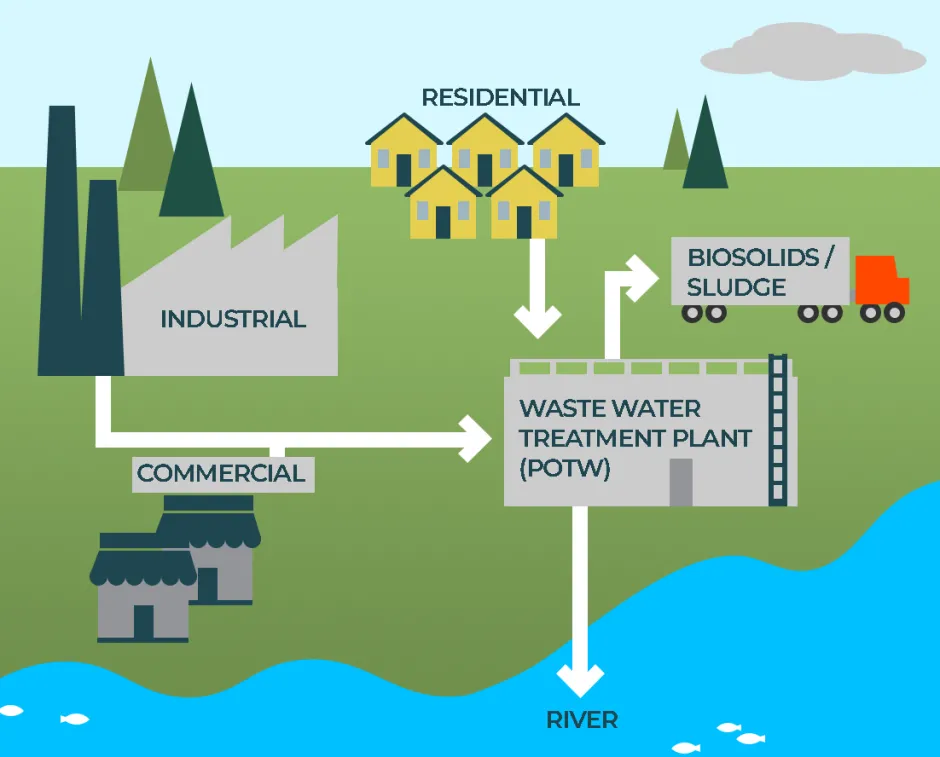
- Around 19% of households are not served by public sewers and depend on septic systems,5 discharging over 4B gal of wastewater below ground every day.6 Failing septic systems may contaminate surface and groundwater.7
Treatment of Municipal Wastewater
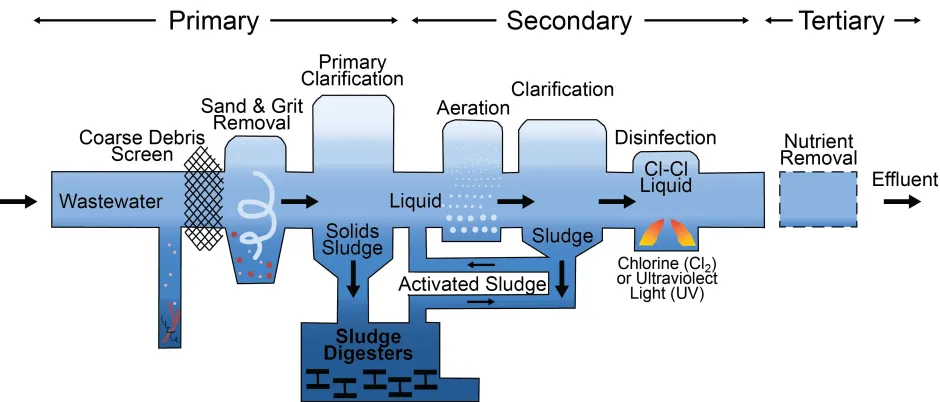
- A common form of wastewater treatment is activated sludge, an aerobic process that exposes microbes to oxygen to break down organic waste.8
- Over 17,000 POTWs treat and discharge over 34B gal/d of wastewater into U.S. waterways.9,10 1.9M mi of piping provide collection, treatment, and disposal services to more than 270M people.9,26
- Use of reclaimed water for consumption is becoming more common, particularly in drought-prone regions or areas with growing water demand (such as the U.S. southwest).11
- POTWs generate over 13.8M tons (dry weight) of sludge (biosolids) annually.10 Sludge treatment accounts for one-third of POTW electricity use.12
- Chlorination is the most common disinfection method in the U.S., often followed by dechlorination to avoid ecological impacts and carcinogenic by-product formation.13 Ultraviolet (UV) disinfection is a chemical-free alternative but has higher maintenance, energy, and capital costs.14
Wastewater Treatment Process15
“Contaminants of emerging concern” (CEC) are unregulated compounds found in many products.16 Per- and polyfluoroalkyl substances (PFAS) and polybrominated diphenyl ethers (PBDE) have become CECs due to their wide distribution and persistence in the environment.17 Some of these chemicals are endocrine disruptors and affect growth and reproduction.18 Many of these chemicals are not removed by POTWs.19 Researchers are currently studying technologies for removing PFAS from drinking and wastewater.20
Biosolids End-of-Life
- Biosolids are nutrient-rich treated sludge resulting from POTW treatment of municipal wastewater.21
- U.S. management practices result in 60% of biosolids being used for land applications (agricultural, home garden, landscaping), with minor amounts applied to forests and reclamation sites, while 38% are landfilled or incinerated.38
Biosolid Use23
Life Cycle Impacts
Wastewater treatment systems reduce environmental impacts in receiving waters but create other life cycle impacts, mainly through energy use. GHG emissions are associated with energy and chemicals used in treatment and with the degradation of organic materials in POTWs.
Electricity Consumption and Emissions
- About 2% of U.S. electricity use goes towards pumping and treating water and wastewater.12
- In 2022, energy-related emissions resulting from POTW operations, excluding organic sludge degradation, were 10.5 Tg CO2e, 4.92 Gg SO2, and 6.19 Gg NOx.12,24
- An estimated 20.8 and 21.9 Mt CO2e of CH4 and N2O, respectively, resulted from wastewater treatment processes in 2022, about 0.7% of U.S. GHG emissions.25
Social and Economic Impacts
- In the U.S., an average household pays $780 annually for wastewater collection and treatment, an 85% increase from 2010.26
- Although sewer systems last longer (50 years) than treatment equipment (15-20 years), sewer renovation can be costly.27
- Nationwide costs for infrastructure to meet identified clean water needs total $630B through 2041. 55% of these needs are for wastewater infrastructure: treatment plant improvements, conveyance systems (new and repair), CSO correction, recycled water distribution, and desalination.9
- The federal government’s share of wastewater capital investment fell from 63% in 1977 to 9% in 2017.39
Solutions and Sustainable Actions
Administrative Strategy
- Investment in wastewater treatment is shifting from new construction to asset management–maintaining original capacity and function. Life cycle costing should be embedded in capital budgeting, and programs for CSO, SSO, and stormwater asset management need to be permanent.28
- To meet ambient water quality standards, total maximum daily loads (TMDLs) including both point and non-point source pollutant loadings can be developed.29
- Federal and state governments have developed strategies to remove emerging pollutants like PFAS from point sources by requiring POTWs and industries to sample for emerging pollutants, enabling source identification and correction.3
- Since 2021, federal funding has increased significantly through the Infrastructure Investment and Jobs Act, providing an additional $11.7B to the water sector (drinking water, wastewater, stormwater).26
- The Water Infrastructure Finance and Innovation Act (WIFIA) program funding also increased from $69.5M in FY22 to $72.3M in FY24 for large multisector infrastructure projects.26
Reduce Loading
- Projects to reduce or divert wastewater flow include disconnecting household rainwater drainage from sanitary sewers, installing green roofs, and replacing impervious surfaces with porous pavement, swales, or French drains.
- Toilets, showers, and faucets represent 64% of indoor water use. Install high-efficiency toilets, composting toilets, low-flow shower heads, faucet aerators, and rain barrels.30 Efficient appliances have contributed to a 22% decline in household water use since 1999.30
Technology Improvements and System Design
- Aeration, which facilitates microbial degradation of organic matter, can account for 25-60% of wastewater treatment plant energy use. Flexible designs allow systems to meet fluctuating oxygen demands by time of day and season.32 Pumping systems use 10-15% of treatment plant energy and this demand can be reduced when pumps, flow control, and motors are matched to plant needs.12
- A number of treatment plants are considering using methane from anaerobic digestion of biosolids as an energy resource.12
- Water reuse can significantly decrease system energy use and reduce nutrient loads to receiving waters.33
- Large-scale urine diversion could decrease nutrient loading in wastewater treatment plants and lead to reductions of up to 47% in GHG emissions and 41% in energy use.34
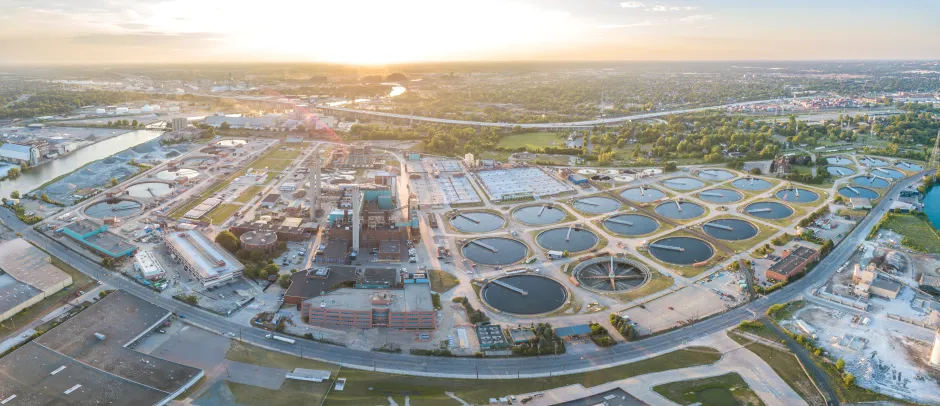
Great Lakes Water Authority (Detroit POTW)36
Center for Sustainable Systems, University of Michigan. 2025. "U.S. Wastewater Treatment Factsheet." Pub. No. CSS04-14.
References
1. Michigan EGLE (2022) "Combined Sewer Overflow (CSO), Sanitary Sewer Overflow (SSO), and Retention Treatment Basin (RTB) Discharge 2021 Annual Report"
2. U.S. Environmental Protection Agency (2004) 2004 NPDES CSO Report to Congress.
3. Michigan Department of Environment, Great Lakes, and Energy (EGLE) (2023) Municipal NPDES Permitting Strategy for PFAS.
4. U.S. Environmental Protection Agency (EPA) (2022) “How's My Waterway? Informing the conversation about your waters.”
https://mywaterway.epa.gov/national
5. U.S. Census Bureau (2025) American Housing Survey 2023 Summary Tables
https://www.census.gov/programs-surveys/ahs/data.2023.html
6. "U.S. EPA (2012) A Homeowners’Guide to Septic Systems"
7. U.S. EPA (2015) “Why Maintain Your Septic System.”
https://www.epa.gov/septic/why-maintain-your-septic-system
8. Song, Y., et al. (2023) An overview of biological mechanisms and strategies for treating wastewater from printing and dyeing processes. Journal of Water Process Engineering, 55: 104242.
https://www.sciencedirect.com/science/article/pii/S2214714423007626
9. U.S. EPA (2022) 2022 Clean Watersheds Needs Survey Report to Congress.
https://www.epa.gov/system/files/documents/2024-05/2022-cwns-report-to-congress.pdf
10. Seiple, T., Coleman, A. and Skaggs, R. (2017) Municipal Wastewater Sludge as a Sustainable Bioresource in the United States. Journal of Environmental Management, 197: 673-680.
https://pubmed.ncbi.nlm.nih.gov/28433683/
11. U.S. EPA (2017) Potable Reuse Compendium.
https://www.epa.gov/sites/production/files/2018-01/documents/potablereusecompendium_3.pdf
12. Electric Power Research Institute (2013) Electricity Use and Management in the Municipal Water Supply and Wastewater Industries.
https://www.epri.com/research/products/000000003002001433
13. U.S. EPA (2004) Primer for Municipal Wastewater Treatment Systems.
https://www.epa.gov/sites/production/files/2015-09/documents/primer.pdf
14. PG&E New Construction Energy Management Program (2006) Energy Baseline Study For Municipal Wastewater Treatment Plants
https://www.baseco.com/_files/ugd/115701_3ac5ae6f0b20458d84d0b629c166eb4e.pdf
15. Adapted from Arkansas Watershed Advisory Group.
16. U.S. EPA (2020) "Contaminants of Emerging Concern including Pharmaceuticals and Personal Care Products."
17. U.S. EPA (2020) "Emerging Contaminants and Federal Facility Contaminants of Concern."
18. U.S. EPA (2021) “Endocrine Disruptor Screening Program (EDSP) Overview.”
19. U.S. EPA (2009) Occurrence of Contaminants of Emerging Concern in Wastewater From Nine Publicly Owned Treatment Works.
20. U.S. EPA (2022) "Increasing Our Understanding of the Health Risks from PFAS and How to Address Them."
https://www.epa.gov/pfas/increasing-our-understanding-health-risks-pfas-and-how-address-them
21. U.S. EPA (2023) Pathogens and Vector Attraction in Sewage Sludge
https://www.epa.gov/biosolids/pathogens-and-vector-attraction-sewage-sludge
23. NEBRA (2022) A National Biosolids Regulation, Quality, End Use & Disposal Survey, 2018 Data.
https://www.biosolidsdata.org/national-summary
24. U.S. EPA (2025) eGRID 2023 Summary Tables.
https://www.epa.gov/egrid/download-data
25. U.S. EPA (2024) Inventory of U.S. Greenhouse Gas Emissions and Sinks 1990 - 2022
https://www.epa.gov/ghgemissions/inventory-us-greenhouse-gas-emissions-and-sinks-1990-2022
26. American Society of Civil Engineer (2025) 2025 Infrastructure Report Card - Wastewater.
https://infrastructurereportcard.org/cat-item/wastewater-infrastructure
27. U.S. EPA (2002) The Clean Water and Drinking Water Infrastructure Gap Analysis.
28. U.S. EPA (1998) Cost Accounting and Budgeting for Improved Wastewater Treatment.
29. U.S. EPA (2020) “Overview of Total Maximum Daily Loads (TMDLs)”
https://www.epa.gov/tmdl/overview-total-maximum-daily-loads-tmdls
30. Water Research Foundation (2016) Residential End Uses of Water, Version 2 Executive Summary.
https://www.circleofblue.org/wp-content/uploads/2016/04/WRF_REU2016.pdf
32. U.S. EPA (2010) Evaluation of Energy Conservation Measures for Wastewater Treatment Facilities.
http://nepis.epa.gov/Exe/ZyPDF.cgi/P1008SBM.PDF?Dockey=P1008SBM.PDF
33. U.S. EPA (2012) 2012 Guidelines for Water Reuse
https://www.epa.gov/waterreuse/guidelines-water-reuse
34. Hilton, S., G. Keoliean, et al. (2020) Life Cycle Assessment of Urine Diversion and Conversion to Fertilizer Products at the City Scale
36. Photo by Katrin Scholz-Barth, courtesy of National Renewable Energy Laboratory, NREL-13397.
37. Zhang, K. et al (2023) The Role of Inflow and Infiltration (II) in Urban WaterBalances and Streamflow Regimes
https://doi.org/10.1029/2022WR032529
38. U.S. EPA (2025) Basic Information about Sewage Sludge and Biosolids
https://www.epa.gov/biosolids/basic-information-about-sewage-sludge-and-biosolids#statistics
39. American Society of Civil Engineer (2021) 2021 Infrastructure Report Card - Wastewater.
https://infrastructurereportcard.org/cat-item/wastewater-infrastructure/