U.S. Renewable Energy Factsheet

Patterns of Use
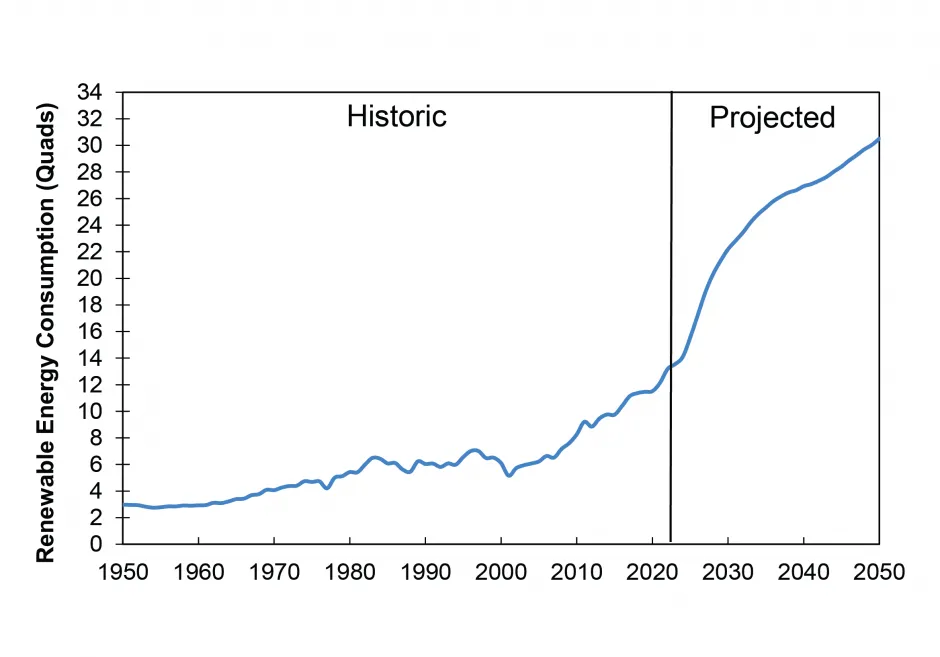
While energy is essential to modern society, most primary sources are unsustainable. The current fuel mix is associated with a multitude of environmental impacts, including global climate change, acid rain, freshwater use, hazardous air pollution, and radioactive waste. Renewable energy has the potential to meet demand with a much smaller environmental footprint and can help to alleviate other pressing problems, such as energy security, by contributing to a distributed and diversified energy infrastructure. About 79% of the nation’s energy comes from fossil fuels, 8.0% from nuclear, and 13.1% from renewable sources. In 2019, renewables surpassed coal in the amount of energy provided to the U.S. and this trend has continued through 2022. Wind and solar are the fastest growing renewable sources, but contribute just 6% of total energy used in the U.S.1
U.S. Renewable Energy Consumption: Historic and Projected1,2
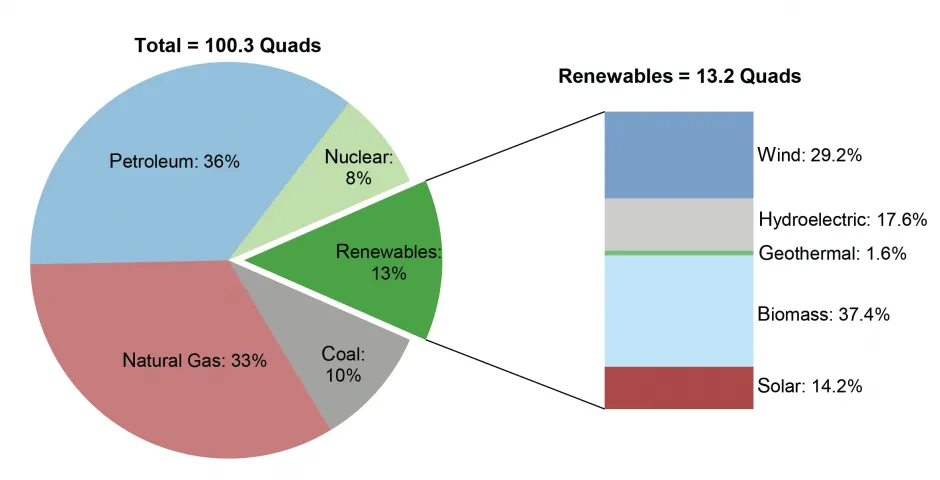
U.S. Total and Renewable Energy Consumption by Source, 20221
Major Renewable Sources
Wind (See Wind Energy Factsheet)
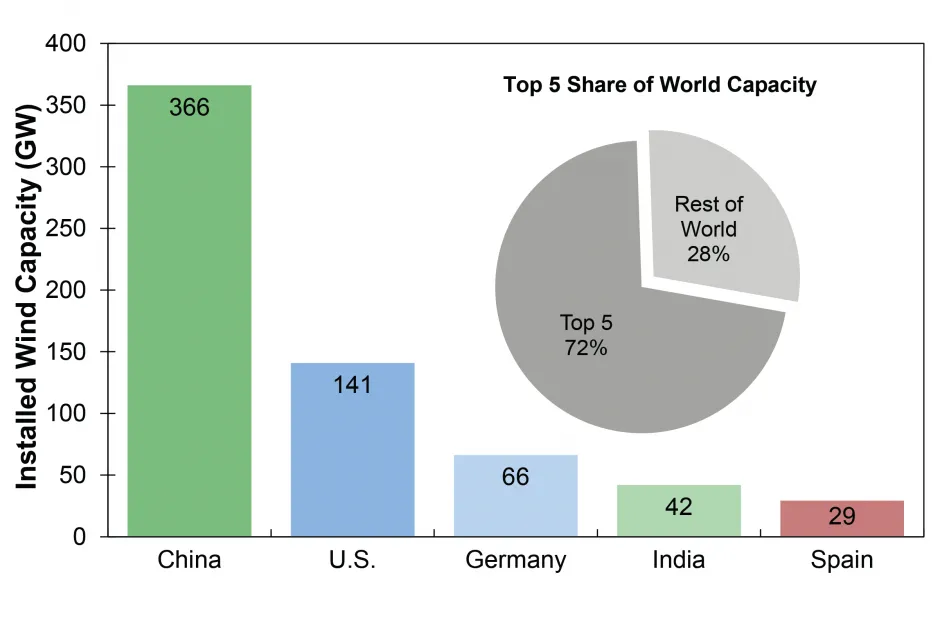
- U.S. onshore wind resources have a potential capacity of almost 11,000 GW and current installed capacity of 140.9 GW.3,4 Offshore wind resources are potentially 4,200 GW, current capacity is 42 MW, and the development pipeline contained over 40,000 MW of capacity of projects in 2022.4,5
- Over 13 GW of wind capacity was installed in the U.S. in 2021 and over 16 GW in 2020.6,7,8
- The federal production tax credit (PTC) significantly influences wind development, but cycles of enactment and expiration lead to year-to-year changes in investment.9 The Inflation Reduction Act (IRA) of 2022 extended and increased the PTC through 2024 for wind projects beginning construction before 2025 with a PTC up to 2.6¢/kWh for 10 years of electricity output.10
- Based on the average U.S. electricity fuel mix, a 1.82 MW wind turbine (U.S. average size in 2021) displaces 3,596 metric tons (t) of CO2 emissions per year.11 By 2050, 404 GW of wind capacity would meet an estimated 35% of U.S. electricity demand and result in 12.3 gigatons (Gt) of avoided CO₂ emissions, a 14% reduction when compared to 2013.12
- Wind turbines generate no emissions and use no water when producing electricity, but concerns include bat and bird mortality, land use, noise, and aesthetics.13
Installed Wind Capacity, Top 5 Countries, 20223
Solar (See Photovoltaic Energy Factsheet)
- Assuming intermediate efficiency, solar photovoltaic (PV) modules covering 0.6% of U.S. land area could meet national electricity demand.15
- PV module prices have declined to an average of $0.36/Watt.16 The U.S. manufactured 1% of PV cells and 2.7% of PV modules globally in 2021.17
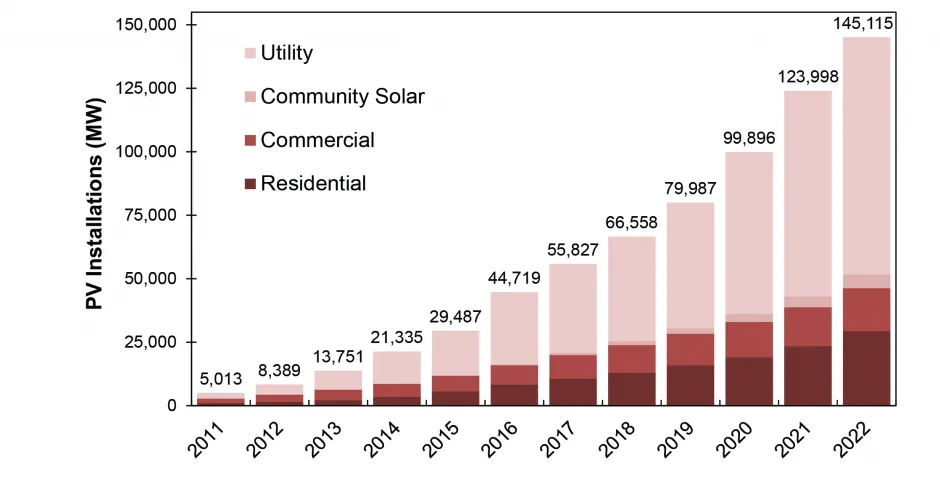
- Solar capacity has grown at an average of 24% annually over the last decade. Total installed capacity increased to almost 150 GW in 2022.14 Solar has added the most generating capacity to the grid for the last four years. It accounted for 54% of new generating capacity in Q1 of 2023. Nearly 30 GW of solar installations are projected to take place in 2023.14
- The IRA provides tax incentives that will increase the demand for solar; PV deployment is expected to nearly triple in cumulative capacity by 2028.14
- The U.S. Department of Energy’s SunShot Initiative aims to reduce the price of solar energy 50% by 2030, which is projected to lead to 33% of U.S. electricity demand met by solar and a 18% decrease in electricity sector greenhouse gas emissions by 2050.18
- While solar PV modules produce no emissions during operation, toxic substances (e.g., cadmium and selenium) are used in some technologies.15
U.S. Photovoltaic Installations, 2011-202214
Biomass (See Biofuels Factsheet)
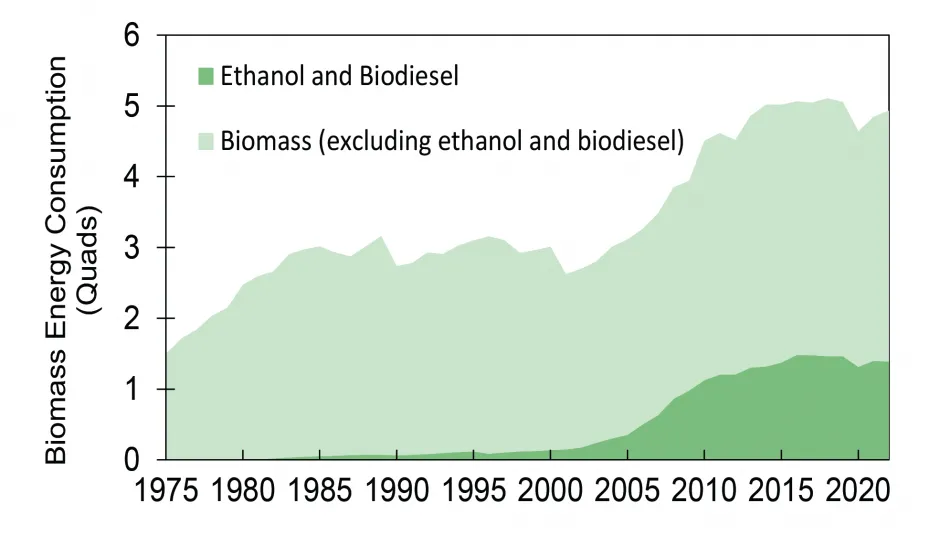
- Wood—mostly as pulp, paper, and paperboard industry waste products—accounts for 43% of total biomass energy consumption. Waste—municipal solid waste, landfill gas, sludge, tires, and agricultural by-products—accounts for an additional 8%.1
- Biomass has low net CO₂ emissions compared to fossil fuels. At combustion, it releases CO₂ previously removed from the atmosphere. Further emissions are associated with processing and growth of biomass, which can require large areas of land. Willow biomass requires 121 acres of land to generate one GWh of electricity per year, more land than other renewable sources.19
- U.S. ethanol production is projected to reach 47 million gallons per day in 2050.2
U.S. Biomass Consumption, 1975-20221
Geothermal (See Geothermal Energy Factsheet)
- Hydrothermal resources, i.e., steam and hot water, are available primarily in the western U.S., Alaska, and Hawaii, yet geothermal heat pumps can be used almost anywhere to extract heat from shallow ground, which stays at relatively constant temperatures year-round.21
- Each year, electricity from hydrothermal sources offsets the emission of 4.1 million U.S. short tons (tons) of CO₂, 80 thousand tons of nitrogen oxides, and 110 thousand tons of particulate matter from coal-powered plants.22 Some geothermal facilities produce solid waste such as salts and minerals that must be disposed of in approved sites, but some by-products can be recovered and recycled.21
- Electricity generated from geothermal power plants is projected to increase from 15.6 billion kWh in 2022 to 37.2 billion kWh in 2050. Geothermal electricity generation has the potential to exceed 500 GW, which is half of the current U.S. capacity.2,23
Geothermal Installed Capacity, Top 5 Countries, 202120

Hydroelectric
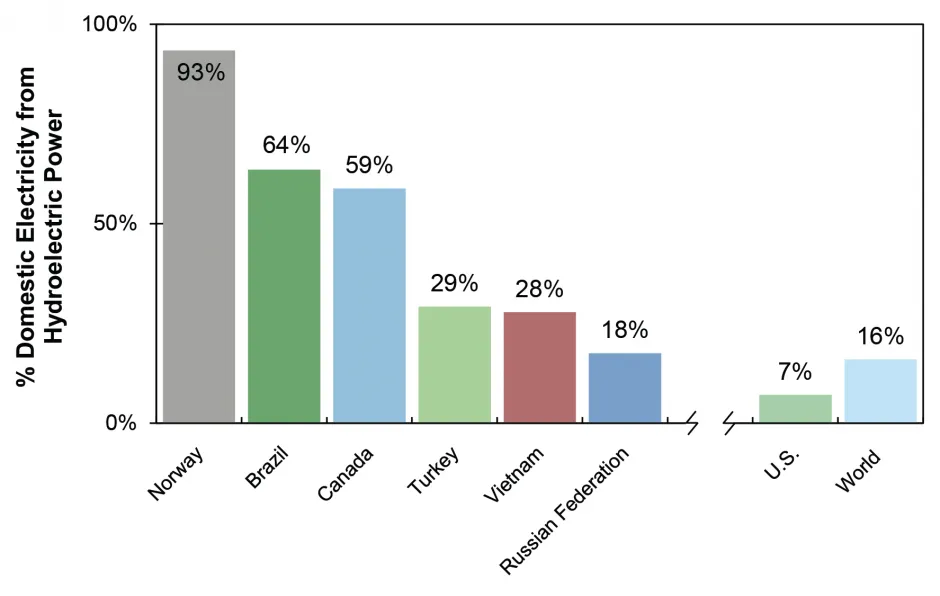
- In the U.S., net electricity generation from conventional hydropower peaked in 1997 at 356 TWh/yr. Currently, the U.S. gets 262 TWh/yr of electricity from hydropower.1
- While electricity generated from hydropower is virtually emission free, significant levels of methane and CO₂ may be emitted through the decomposition of vegetation in the reservoir.25 Other environmental concerns include fish injury and mortality, habitat degradation, and water quality impairment. “Fish-friendly” turbines and smaller dams help mitigate some of these problems.26
Hydropower Electricity Generation, 201924
Advancing Renewable Energy
Encourage Supportive Public Policy
- Lawrence Berkeley National Laboratory estimates that 45% of renewable energy growth in the U.S. can be attributed to state Renewable Portfolio Standards (RPS) that require a percentage of electricity be derived from renewable sources.27 Clean Energy Standards (CES) that mandate certain levels of carbon-free generation can include some non-renewables such as nuclear fuels.28 Thirty-six states, the District of Columbia, and four U.S. territories had renewable portfolio standards or goals in place as of November 2022.29 State standards are projected to support an additional 90 GW of renewable electricity projects by 2030.27
- Renewable energy growth is also driven by important federal incentives such as the Investment Tax Credit, which offsets upfront costs, as well as state incentives such as tax credits, grants, and rebates. 30
- Eliminating subsidies for fossil and nuclear energy would encourage renewable energy. Congress allocated over $5.7 billion in tax relief to the oil and gas industries for fiscal years 2020-2024.31 Studies estimate that the Price-Anderson Act, which limits the liability of U.S. nuclear power plants in the case of an accident, amounts to a subsidy of $366 million to $3.5 billion annually.32
- Net metering enables customers to sell excess electricity to the grid, eliminates the need for on-site storage, and provides an incentive for installing renewable energy devices. Thirty-nine states, the District of Columbia, and four U.S. territories have some form of net metering program.33
Engage the Industrial, Residential, and Commercial Sectors
- Renewable Energy Certificates (RECs) are sold by renewable energy producers in addition to the electricity they produce; for a few cents per kilowatt hour, customers can purchase RECs to “offset” their electricity usage and help renewable energy become more cost competitive.34 Around 850 utilities in the U.S. offer consumers the option to purchase renewable energy, or “green power.”35
- Many companies purchase renewable energy as part of their environmental programs. Google, Microsoft, T-Mobile, Walmart, and The Proctor & Gamble Company were the top five users of renewable energy as of April 2023.36
| kWh = kilowatt hour. One kWh is the amount of energy required to light a 100 watt light bulb for 10 hours. Btu = British Thermal Unit. One Btu is the amount of energy required to raise the temperature of a pound of water by 1° Fahrenheit. Quad = quadrillion (1015) Btu. One Quad is equivalent to the annual energy consumption of ten million U.S. households. |
Center for Sustainable Systems, University of Michigan. 2023. "U.S. Renewable Energy Factsheet." Pub. No. CSS03-12.
References
- U.S. Energy Information Administration (EIA) (2023) Monthly Energy Review May 2023.
- U.S. EIA (2023) Annual Energy Outlook 2023.
- International Renewable Energy Agency (IRENA) (2023) Renewable Capacity Statistics 2023.
- Lopez, A., et al. (2012) U.S. Renewable Energy Technical Potentials A GIS-Based Analysis. National Renewable Energy Laboratory (NREL).
- U.S. Department of Energy (DOE) (2022) Offshore Wind Market Report 2022.
- U.S. DOE (2022) 2022 Land-Based Wind Market Report.
- U.S. Department of Energy (DOE) (2021) 2021 Land-Based Wind Market Report.
- U.S. DOE (2021) Offshore Wind Market Report.
- NREL (2014) Implications of a PTC Extension on U.S. Wind Deployment.
- U.S. DOE, EERE (2021) “Production Tax Credit and Investment Tax Credit For Wind Energy.”
- U.S. Environmental Protection Agency (EPA) (2023) Greenhouse Gases Equivalencies Calculator - Calculations and References.
- U.S. DOE (2015) Wind Vision Report.
- U.S. DOE (2021) Environmental Impacts and Siting of Wind Projects.
- Solar Energy Industries Association (SEIA) (2023) “Solar Industry Research Data.”
- U.S. DOE (2012) SunShot Vision Study.
- NREL (2023) Spring 2023 Solar Industry Update.
- International Energy Agency (IEA) (2022) Trends in Photovoltaic Applications 2022.
- NREL (2017) SunShot 2030 for Photovoltaics (PV): Envisioning a Low-cost PV Future.
- Keoleian, G. and T. Volk (2005) Renewable Energy from Willow Biomass Crops: Life Cycle Energy, Environmental and Economic Performance”
- IRENA (2023) Dashboard - Capacity and Generation.
- U.S. DOE, EERE (2020) “Geothermal FAQs.”
- U.S. DOE EERE (2018) Geothermal Power Plants - Meeting Clean Air Standards.
- NREL (2014) Accelerating Geothermal Research.
- IEA (2021) Key World Energy Statistics 2021.
- Arntzen, E., et al. (2013) Evaluating greenhouse gas emissions from hydropower complexes on large rivers in Eastern Washington. Pacific Northwest National Laboratory.
- Kumar, A. and T. Schei (2011) “Hydropower.” Cambridge University Press.
- Barbose, G. (2021) U.S. Renewables Portfolio Standards 2021 Status Update: Early Release.
- Congressional Research Service (2020) Electricity Portfolio Standards: Background, Design Elements, and Policy Considerations.
- DSIRE (2022) Renewable and Clean Energy Standards.
- DSIRE (2022) “Business Energy Investment Tax Credit.”
- Joint Committee on Taxation (2020) Estimates of Fed. Tax Expenditures for Fiscal Years 2020-2024.
- Prepared Witness Testimony of Anna Aurilio on Hydroelectric Relicensing and Nuclear Energy before the House Committee on Energy and Commerce, June 27 2001.
- DSIRE (2021) USA Summary Maps: Net Metering.
- U.S. EPA (2019) “Renewable Energy Certificates 101: Market Instruments and Claims.”
- U.S. EPA (2018) “Utility Green Power Products.”
- U.S. EPA (2023) “Green Power Partnership National Top 100.”
Where to go from here
Biofuels Factsheet »


Wind Energy Factsheet »