Unconventional Fossil Fuels Factsheet
Pattern of Use
Fossil fuels supply 82% of U.S.1 and 80% of global energy.2 This is projected to drop below 60% globally by 2050.2 Conventional and unconventional fossil fuels differ in their geologic location and accessibility; conventional fuels are found in discrete, easily accessible reservoirs, while unconventional fuels are distributed throughout wide geologic formations, requiring advanced extraction techniques.3 If unconventional oil resources (oil shale, tar sands, extra heavy oil, and natural bitumen) are included, global oil reserves are quadruple current conventional reserves.4 The shale gas and tight oil boom has transformed the U.S. into the world’s top oil and gas producer and a leading exporter.5
Global Projected Liquid Fuel Production (M bbl/d)6
Major Unconventional Sources
Unconventional Natural Gas
- Unconventional natural gas (UG) comes primarily from three sources: shale gas in low-permeability shale formations; tight gas in low-permeability sandstone and carbonate reservoirs; and coalbed methane (CBM) in coal seams.7
- UG, particularly shale and tight gas, is most commonly extracted through hydraulic fracturing (“fracking”). A mixture of water and sand is pumped underground at extreme pressures to create cracks in the geologic formation, allowing gas to flow out. When pressure is released, some fluid returns as “flowback,” while sand remains as a “proppant,” keeping the fractures open.7
- By current estimates, China has the largest technically recoverable shale gas resource with 1,115T cubic feet (Tcf), followed by Argentina (802 Tcf), Algeria (707 Tcf) and the U.S. (623 Tcf).8
- Global tight gas resources are estimated at 2,684 Tcf, with the largest amounts in Asia/Pacific and Latin America. CBM resources are estimated at 1,660 Tcf, with over 75% in Eastern Europe/Eurasia and Asia/Pacific.7
U.S. Shale Gas and Non-Shale Gas Production (Bcf/d)11
- Recoverable U.S. resources include 1,778 Tcf from shale and tight gas, and 76 Tcf from CBM.9 UG was 91% (35 Tcf) of U.S. dry natural gas production in 2024 and is expected to reach 97% by 2050.10 U.S. shale gas production increased twenty-four-fold since 2000, reaching 30 Tcf in 2024.11
Tight Oil
- Tight oil (shale oil) is found in impermeable rocks such as shale or limestone and is extracted through fracking, often concurrently with natural gas.12 The U.S. has an estimated 191B bbl of technically recoverable tight oil.9
- Tight oil production has expanded significantly over the past decade. In 2024, 67% (8.93M bbl/d) of U.S. crude oil production came from tight oil.13
- Negative health effects in newborns from in utero exposure to fracking sites have been found in multiple studies.14, 15, 16, 17, 18
U.S. Tight Oil & Conventional Oil Production (M bbl/d)11
Tar Sands
- Tar sands (also called “oil sands” or “natural bitumen”) are a combination of sand (83%), bitumen (10%), water (4%), and clay (3%). Bitumen is a semisolid, tar-like mixture of hydrocarbons.19
- Known tar sands deposits exist in 23 countries.20 Canada has 73% of global estimated tar sands, approximately 2.4T bbl of oil. The U.S. has 1.6% of global tar sands resources;20 62% of U.S. crude oil imports came from Canada in 2024,21 and 65% of Canadian production is from tar sands.22
- Deposits less than 250 feet below the surface are mined and processed to separate the bitumen.23
- Deeper deposits employ in situ (underground) methods, including steam or solvent injection to liquefy bitumen for extraction.19 Bitumen must be upgraded to synthetic crude oil (SCO) before it is refined into oil products.19 Around two tons of tar sands produce one barrel of SCO.19
Oil Shale
- Oil shale is sedimentary rock containing organic compounds called kerogen, which has not undergone sufficient geologic pressure, heat, and time to become conventional oil. Oil shale can be heated to generate petroleum-like liquids.24
- Oil shale deposits exist in 33 countries.4 The U.S. has the world’s largest oil shale resource at ~6T bbl,4 though oil shale is far from commercial development.25
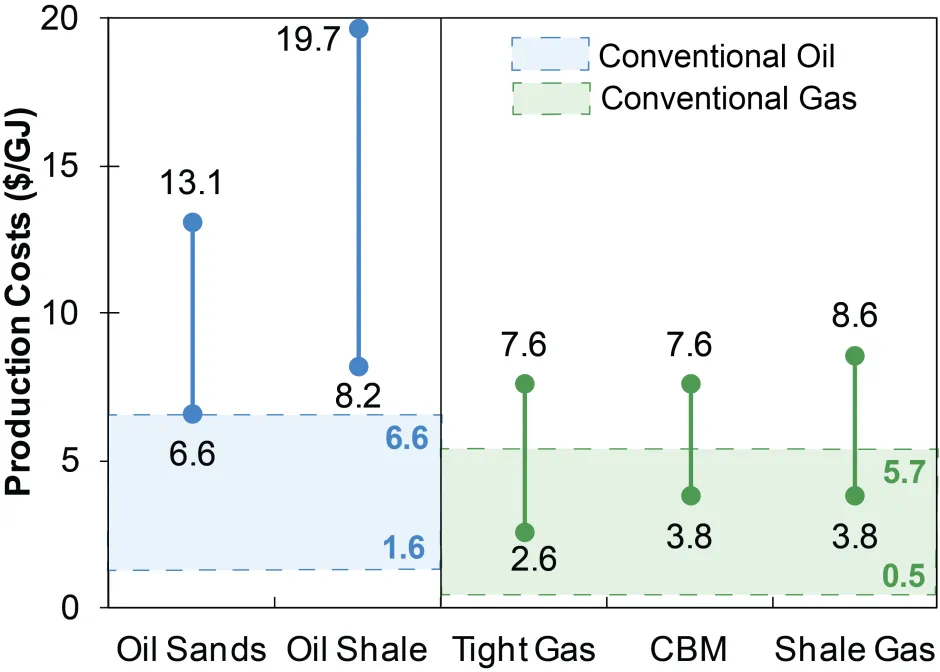
Production Cost Ranges ($/GJ)19
Life Cycle Impacts
Greenhouse Gas Emissions (See Greenhouse Gases Factsheet)
- Fossil fuel combustion accounted for 74% of U.S. GHG emissions in 2022.
- Conventional and unconventional fuels release equivalent GHGs at the point of use. Life cycle emissions for unconventional oil average higher than conventional oil, though some studies suggest they are similar.27 Life cycle emissions for shale gas range from 6% lower28 to 43% higher than conventional natural gas.29 Tar sands life cycle emissions are 17% higher than average refined U.S. crude,30 while oil shale emissions are 21%-47% higher than conventional oil.31
- NG generates fewer GHG emissions when combusted than other fossil fuels,32 but CH4 leakage can significantly decrease any emissions benefit.28 CH4 leakage from the U.S. oil and gas supply chain is estimated to be 13 Mt/yr, equivalent to 2.3% of annual gross NG production and nearly 42% of U.S. anthropogenic CH4 emissions.33 With CH4’s global warming potential of almost 30,34 this is equivalent to 387 Mt of CO2, or 6.1% of total U.S. GHG emissions in 2022.26
Water
- Producing one bbl of oil from oil shale uses 1-12 bbl of water for in situ production and 2-4 bbl of water for mining;35 one bbl of oil from tar sands uses 0.4-3.1 bbl of water;36 one bbl of oil from Saudi Arabia uses 1.4 bbl of water.37
- A horizontal gas well can require 2-4M gal of water to drill and fracture.38 One study found shale gas production uses up to four times more water than producing conventional NG.32
- CBM production requires groundwater extraction; U.S. CBM basins withdraw 32M to 15B gal/yr of water from aquifers.39
- Wastewater from oil and gas extraction can contain excess salts, high levels of trace elements, and naturally-occurring radioactive materials.40 Groundwater can be polluted through above- and below-ground activities, including construction, drilling, chemical spills, leaks, and discharge of wastewater.41
Land Impacts and Waste
- More than 75% of U.S. oil shale is on federal land,42 of which 678,700 acres are designated for development.43 A 20,000 bbl/d tar sands facility requires 2,950 acres of land and creates 52,000 tons/d of waste sand; a 25k-30k bbl/d oil shale facility requires 300-1,200 ac and creates 17-23M ton/yr of waste.44 Oil shale facilities are active for several years.44
- One gas well requires 1-2 ha of land, in addition to road networks.45 Drilling fluid (“mud”) is used to cool drill bits, regulate pressure, and remove rock fragments. One well may require hundreds of tons of mud and produce 110-550 tons of rock cuttings.7
- Small to moderate magnitude (<M6) seismic activity has been linked to underground injection of oil and gas wastewater.46 Fracking has been associated with microearthquakes (<M2) but not with larger magnitude events.47
- The human toxicity impact (HTI) of electricity produced from shale gas is estimated to be lower than that from coal. Particulate matter is the dominant factor for both systems.48
Solutions and Sustainable Actions
- As of 2024, only five states have banned fracking, including Vermont (2012), New York (2020), Maryland (2017), Washington (2019), and California (2024).49
- Chemicals used in hydraulic fracturing fluid are often proprietary.50 Requiring companies to disclose them will lead to better understanding of public health risk from their use.38 26 U.S. states require disclosures through FracFocus.51
- Careful siting and monitoring of injection wells can reduce the potential for seismic events.7
- Efficiency improvements and wastewater recycling can significantly reduce water used in oil and gas extraction.
- Nearly 60% of oil and fossil methane gas reserves must remain unextracted by 2050 to stay within a 1.5 °C carbon budget.52
Center for Sustainable Systems, University of Michigan. 2025. "Unconventional Fossil Fuels Factsheet." Pub. No. CSS13-19.
References
- U.S. EIA (2025) Monthly Energy Review July 2025 https://www.eia.gov/totalenergy/data/monthly/index.php
- IEA (2024) World Energy Outlook 2024 https://iea.blob.core.windows.net/assets/86ede39e-4436-42d7-ba2a-edf61467e070/WorldEnergyOutlook2023.pdf
- Behrens, C., et al. (2011) U.S. Fossil Fuel Resources: Terminology, Reporting, and Summary https://fas.org/sgp/crs/misc/R40872.pdf
- World Energy Council (2016) World Energy Resources 2016. https://www.worldenergy.org/wp-content/uploads/2016/10/World-Energy-Resources-Full-report-2016.10.03.pdf
- IEA (2019) The US shale revolution has reshaped the energy landscape at home and abroad, according to latest IEA policy review https://www.iea.org/news/the-us-shale-revolution-has-reshaped-the-energy-landscape-at-home-and-abroad-according-to-latest-iea-policy-review
- U.S. EIA (2018) Annual Energy Outlook 2018. https://www.eia.gov/outlooks/aeo/?filter=international%20-%20international
- IEA (2012) "Golden Rules for a Golden Age of Gas: World Energy Outlook Special Report on Unconventional Gas." https://www.iea.org/reports/golden-rules-for-a-golden-age-of-gas
- U.S. EIA (2015) World Shale Resource Assessments http://www.eia.gov/analysis/studies/worldshalegas/
- U.S. EIA (2023) Assumptions to the Annual Energy Outlook 2023: Oil and Gas Supply Module. https://www.eia.gov/outlooks/aeo/assumptions/pdf/OGSM_Assumptions.pdf
- U.S. EIA (2025) Annual Energy Outlook 2025 https://www.eia.gov/outlooks/aeo/tables_ref.php
- U.S. EIA (2025) Short-Term Energy Outlook https://www.eia.gov/outlooks/steo/data/browser/#/?v=33&f=A&s=&ctype=linechart&maptype=0&id=
- Union of Concerned Scientists (2016) "What is Tight Oil?" https://www.ucsusa.org/resources/what-tight-oil
- Raimi, D. (2018) The Health Impacts of the Shale Revolution. Resources for the Future. https://media.rff.org/documents/RFF-IB-18-04.pdf
- Hill, E. L., & Ma, L. (2022). Drinking water, fracking, and infant health. https://www.sciencedirect.com/science/article/pii/S0167629622000157#sec0004
- Currie, J., Greenstone, M., & Meckel, K. (2017). Hydraulic fracturing and infant health: New evidence from Pennsylvania. https://www.science.org/doi/10.1126/sciadv.1603021
- Apergis, N., Hayat, T., & Saeed, T. (2019). Fracking and infant mortality: fresh evidence from Oklahoma. https://www.ncbi.nlm.nih.gov/pmc/articles/PMC6875147/
- Schuele, Hailee, et al. (2022) Associations between proximity to gas production activity in counties and birth outcomes across the US. https://www.ncbi.nlm.nih.gov/pmc/articles/PMC9554803/
- IEA Energy Technology Network (2010) Unconventional Oil & Gas Production. https://iea-etsap.org/E-TechDS/PDF/P02-Uncon_oil&gas-GS-gct.pdf
- World Energy Council (2010) 2010 Survey of Energy Resources. https://www.worldenergy.org/assets/downloads/ser_2010_report_1.pdf
- U.S. EIA (2025) U.S. Crude Oil Imports by Country of Origin https://www.eia.gov/dnav/pet/pet_move_impcus_a2_nus_epc0_im0_mbbl_a.htm
- Natural Resources Canada (2024) "Energy Fact Book 2024-2025" https://energy-information.canada.ca/sites/default/files/2024-10/energy-factbook-2024-2025.pdf
- Ramseur, J., et al. (2014) Oil Sands and the Keystone XL Pipeline. Congressional Research Service. http://www.fas.org/sgp/crs/misc/R42611.pdf
- Colorado School of Mines (2020) “About Oil Shale.” https://libguides.mines.edu/oilshale
- U.S. EIA (2017) Annual Energy Outlook 2017. https://www.eia.gov/outlooks/aeo/?filter=international%20-%20international
- U.S. EPA (2024) Inventory of U.S. Greenhouse Gas Emissions and Sinks: 1990-2022. https://www.epa.gov/ghgemissions/inventory-us-greenhouse-gas-emissions-and-sinks-1990-2022
- Argonne National Laboratory (2015) "Analysis shows GHG emissions similar for shale, crude oil." https://www.anl.gov/article/analysis-shows-greenhouse-gas-emissions-similar-for-shale-crude-oil
- Burnham, A., et al. (2012) "Life-Cycle Greenhouse Gas Emissions of Shale Gas, Natural Gas, Coal, and Petroleum." Environmental Science & Technology, 46(2): 619-627. http://pubs.acs.org/doi/abs/10.1021/es201942m
- Howarth, R., et al. (2011) "Methane and the greenhouse-gas footprint of natural gas from shale formations." Climatic Change, 106(4): 679-690. http://link.springer.com/article/10.1007%2Fs10584-011-0061-5
- Lattanzio, R. (2014) Canadian Oil Sands: Life Cycle Assessments of Greenhouse Gas Emissions https://www.fas.org/sgp/crs/misc/R42537.pdf
- Brandt, A. (2008) "Converting Oil Shale to Liquid Fuels: Energy Inputs and Greenhouse Gas Emissions of the Shell in Situ Conversion Process." Environmental Science & Technology, 42(19): 7489-7495. https://pubs.acs.org/doi/full/10.1021/es800531f
- Clark, C., et al. (2013) Hydraulic Fracturing and Shale Gas Production: Technology, Impacts, and Regulations. Argonne National Laboratory. http://www.osti.gov/scitech/biblio/1054498
- Alvarez, R. et al. (2018) Assessment of methane emissions from the U.S. oil and gas supply chain. Science, 361(6398): 186-188. https://science.sciencemag.org/content/361/6398/186
- Intergovernmental Panel on Climate Change (2021) Climate Change 2021: The Physical Science Basis. https://www.ipcc.ch/report/ar6/wg1/
- U.S. Government Accountability Office (GAO) (2011) Impacts of Potential Oil Shale Development on Water Resources. https://www.gao.gov/assets/130/126827.pdf
- Yale School of the Environment (2013) "With Tar Sands Development, Growing Concern on Water Use." https://e360.yale.edu/features/with_tar_sands_development_growing_concern_on_water_use
- Wu, M. and Y. Chiu (2011) Consumptive Water Use in the Production of Ethanol and Petroleum Gasoline - 2011 Update. Argonne National Laboratory. http://greet.es.anl.gov/publication-consumptive-water
- U.S. Department of Energy (2009) Modern Shale Gas Development in the United States: A Primer. http://energy.gov/sites/prod/files/2013/03/f0/ShaleGasPrimer_Online_4-2009.pdf
- U.S. EPA (2010) Coalbed Methane Extraction: Detailed Study Report. http://nepis.epa.gov/EPA/html/DLwait.htm?url=/Exe/ZyPDF.cgi/P100MQJE.PDF?Dockey=P100MQJE.PDF
- U.S. EPA (2020) “Unconventional Oil and Gas Extraction Effluent Guidelines.” https://www.epa.gov/eg/unconventional-oil-and-gas-extraction-effluent-guidelines
- U.S. Geological Survey (USGS) (2012) Water Quality Studied in Areas of Unconventional Oil and Gas Development, Including Areas Where Hydraulic Fracturing Techniques are Used, in the United States. http://pubs.usgs.gov/fs/2012/3049/FS12-3049_508.pdf
- U.S. DOE (2012) Assessment of Plans and Progress on U.S. Bureau of Land Management Oil Shale RD&D Leases in the United States. https://www.energy.gov/sites/prod/files/2013/04/f0/BLM_Final.pdf
- U.S. BLM (2017) Final Oil Shale Rule. https://www.blm.gov/documents/national-office/public-room/blm-library/oil-shale-management-final-rule
- U.S. Bureau of Land Management (BLM) (2012) Proposed Land Use Plan Amendments for Allocation of Oil Shale and Tar Sands Resources on Lands Administered by the Bureau of Land Management in Colorado, Utah, and Wyoming and Final Programmatic Environmental Impact Statement. http://ostseis.anl.gov/documents/peis2012/index.cfm
- United Nations Environment Programme (2012) "Gas fracking: can we safely squeeze the rocks?" https://na.unep.net/geas/archive/pdfs/GEAS_Nov2012_Fracking.pdf
- USGS (2020) “Myths and Misconceptions About Induced Earthquakes.” https://www.usgs.gov/natural-hazards/earthquake-hazards/science/myths-and-misconceptions-about-induced-earthquakes?qt-science_center_objects=0#qt-science_center_objects
- Ellsworth, W. (2013) "Injection-Induced Earthquakes." Science, 341: 6142. http://www.sciencemag.org/content/341/6142/1225942.short
- Chen, L., et al. (2017) “Comparative Human Toxicity Impact of Electricity Produced from Shale Gas and Coal.” Environmental Science and Technology 51(21): 13018–13027. https://pubs.acs.org/doi/abs/10.1021/acs.est.7b03546
- FracTracker Alliance (2024) Fracking Bans https://www.fractracker.org/2024/08/fracking-bans
- United Nations Environment Programme (2012) "Gas fracking: can we safely squeeze the rocks?" https://na.unep.net/geas/archive/pdfs/GEAS_Nov2012_Fracking.pdf
- FracFocus (2024) Regulations https://fracfocus.org/explore/regulations
- Welsby, D., Price, J., Pye, S. et al.(2021) Unextractable fossil fuels in a 1.5 °C world. https://www.nature.com/articles/s41586-021-03821-8