U.S. Energy System Factsheet
Energy is essential to modern life, powering systems that provide food, shelter, transportation, and employment. In 2023, U.S. customers spent $1.6T on energy, 5.7% of GDP, or $4,657 per person, a 10% decrease from 2022.1 Energy production and use contribute to global climate change, acid rain, air pollution, smog, radioactive waste, and habitat destruction.2 Heavy reliance on fossil fuels poses major energy security concerns.
Patterns of Use
Demand
- The U.S. has 4% of the world’s population, uses 16% of the world’s energy, and produces 15% of world GDP.4,5 In comparison, the EU has 6% of the world’s population, uses 9% of its energy, and accounts for 15% of its GDP.4,5 China has 18% of the world’s population, uses 27% of its energy, and contributes 19% of its GDP.4,5
- Daily per capita energy use in the U.S. includes 2.5 gal oil, 6.59 lbs coal, and 265 ft3 natural gas.3, 4 Daily electricity use is 12 kWh per capita in the residential sector.3,4
- In 2023, U.S. energy consumption rose 6% from 2020, but remained 4% below its 2005 peak.3
- Energy efficiency gains in any sector may be offset by increases in use, a phenomenon called the rebound effect.6
U.S. Energy Consumption by Year3
Supply
- U.S. DOE estimates 71% of U.S. energy will come from fossil fuels in 2050,8 inconsistent with IPCC carbon reduction goals.9
- Renewable energy use is projected to grow at an average annual rate of 3.5% from 2024 to 2050, compared to -0.2% for total energy use.8 At this pace, renewables would provide 22% of U.S. energy use by 2050.8
- Canada, Mexico, and Saudi Arabia are the largest suppliers of U.S. oil imports. In 2023, 16% of U.S. oil imports were from OPEC (Organization of the Petroleum Exporting Countries) members, and 10% was from the Persian Gulf,10 which holds 49% of world oil reserves (15% in Saudi Arabia alone).35
- Since 2020, the U.S. has been a net exporter of petroleum. In 2024, it exported 10.76M bbl/d and imported 8.42M bbl/d.3
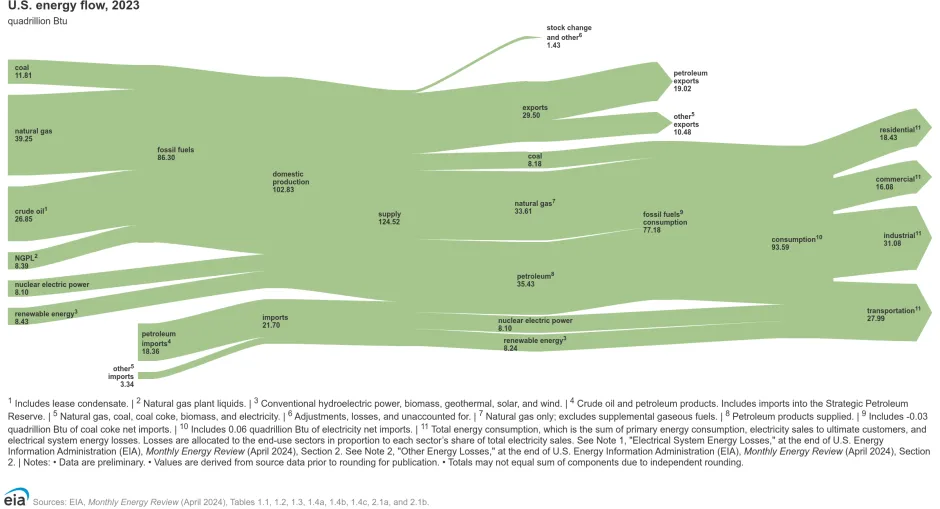
U.S. Energy Flow, 20237
Life Cycle Impacts
- The primary environmental impacts of the U.S. energy system are from fossil fuel combustion, which emits CO₂, NOX, SO₂, VOCs, PM, and Hg.
- Methane leakage from oil and natural gas infrastructure (e.g., fracking wells, pipelines) is estimated at 13 Mt/yr, 2.3% of U.S. gross natural gas production.11 Given methane’s global warming potential of almost 30, this leakage is equivalent to 387 Mt CO₂, 6.1% of total U.S. CO₂e emissions in 2022.12,13
- In 2022, U.S. greenhouse gas (GHG) emissions were 3% below 1990 levels, with 74% from fossil fuel combustion.13 The U.S. made up 14% of world energy-related emissions in 2023,14 and are projected to decrease 21% by 2035 from 2024.8
- Other energy sources also have environmental implications; Nuclear power generates radioactive waste and requires significant energy for plant construction and uranium mining. Large hydroelectric power plants cause habitat degradation and fish mortality. Wind turbines alter landscapes and can cause bird and bat mortality.15
U.S. GHG Emissions by Gas in 2022 (Mt CO13e)12
Solutions and Sustainable Actions
Consume less
- Reducing energy use offers both environmental benefits and cost savings for individuals, businesses, and governments.
- Living in smaller houses, living closer to work, and using public transportation reduce energy use. See factsheets on carbon footprint, personal transportation, and residential buildings.
Increase Efficiency
- An aggressive commitment to energy efficiency could reduce U.S. carbon emissions by 57% (2,500 Mt) by 2050.16
- Additional information on energy efficiency can be found at the following organizations’ websites:
- General: U.S. DOE Energy Efficiency and Renewable Energy
- Residential & Commercial: U.S. EPA Energy Star
- Transportation: U.S. DOE and EPA Fuel Economy Guide
- Industrial: U.S. EPA Energy Star recommended practices to decrease water and energy use and reduce emissions.
Increase Renewables (See U.S. Renewable Energy Factsheet)
- In 2022, annual U.S. renewable energy generation surpassed coal for the first time in history. By 2025, domestic solar generation is projected to increase by 75%, and wind by 11%.37
- U.S. wind capacity grew from 45 GW in 2010 to 147 G W in 2023.17 If expanded to 224 GW by 2030 (deemed feasible by the U.S. DOE), wind could supply 20% of projected electricity demand.18
- The U.S. has an estimated 463,400 TWh of renewable energy technical potential—more than 100 times the 4,000 TWh of electricity used in 2020. In 2020, only 0.2% of this potential was used for electricity production.38
- Solar photovoltaic (PV) modules covering 0.6% of U.S. land area could meet national electricity demand.19
- The U.S. joined 132 other countries in the Global Renewables and Energy Efficiency Pledge, committing to triple global installed renewable capacity to 11,000 GW by 2030.20
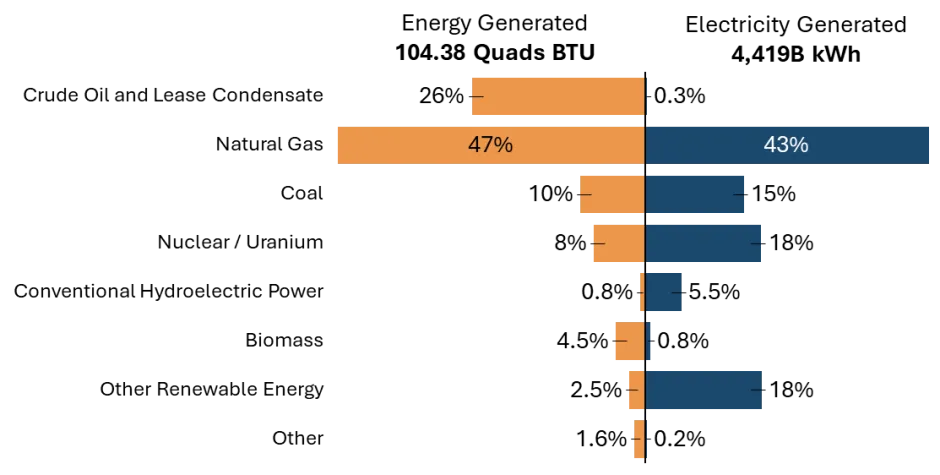
U.S. Sources of Energy and Electricity8
Encourage Supportive Public Policy
- 107 parties representing 108 countries and 82% of global GHG emissions have adopted net-zero targets: 29 in law (e.g., the U.K.), 61 in policy documents (e.g., the U.S.), 17 as pledges.21
- Fossil fuel subsidies remain a major barrier to clean energy.22 Global fossil fuel subsidies reached a record $7T in 2022, with $760B from the U.S.23 The U.S. Congress allocated $6.1B in tax relief to oil and gas industries for FY2024-2028.24
- Carbon cap-and-trade policies could support renewable energy by placing a price on carbon and raising the cost of fossil fuel energy generation.25
- The growth of renewable energy was spurred by a 2.5¢/kWh federal production tax credit (PTC) and the 30% energy investment tax credit (ITC).26
- The Inflation Reduction Act (IRA) extended the ITC and PTC of 2.75¢/kWh for eligible renewable energy systems through 2027.27,34 Federal tax credits cut energy-efficiency home upgrade costs by up to 30% or $3,200 annually and provided a 30% credit for clean energy equipment, such as rooftop solar, geothermal heat pumps, and energy storage.28
- In 2023, taxpayers received more than $6B in residential clean energy credits, and over $2B in energy efficiency home improvement credits.29 These credits are available through 2025.34, 36
- Roughly half of renewable electricity growth in the U.S. since 2000 is attributable to state Renewable Portfolio Standards (RPS), which require a portion of electricity to come from renewable sources.31
- As of April 2025, 35 states, D.C., and 4 U.S. territories have Renewable Portfolio Standards or goals and 18 states have adopted Clean Energy Standards or goals, which mandate certain levels of carbon-free generation and may include some non-renewables such as nuclear fuels.30,32
- State governments also support renewable energy through a variety of policies and incentives, including rebate, grant, and loan programs; building energy and efficiency standards; solar and wind permitting; and financial incentives such as tax credits, deductions, exemptions, feed-in tariffs, net metering, and Property Assessed Clean Energy (PACE) programs.33See the “Renewable Energy Factsheet” for more.
- Under the Inflation Reduction Act, eligible new electric, plug-in hybrid, and fuel cell electric vehicles qualified for a federal tax credit of up to $7,500 through 2032. Recent legislation reverts this to September 2025.39,40 See the “Personal Transportation Factsheet” for more transportation policies.
States with Renewable / Clean Energy Standards or Goals31
Center for Sustainable Systems, University of Michigan. 2025. "U.S. Energy System Factsheet." Pub. No. CSS03-11.
References
1. U.S. Energy Information Administration (EIA) (2025) State Energy Data System (SEDS) 1970-2023: Prices and Expenditures.
https://www.eia.gov/state/seds/seds-data-complete.php?sid=US#PricesExpenditures
2. U.S. EIA (2020) "Electricity Explained - Electricity and the Environment."
https://www.eia.gov/energyexplained/electricity/electricity-and-the-environment.php
3. U.S. EIA (2025) Monthly Energy Review June 2025
https://www.eia.gov/totalenergy/data/monthly/
4. U.S. Central Intelligence Agency (2025) The World Factbook.
https://www.cia.gov/the-world-factbook/countries/
5. U.S. EIA (2025) “International Energy Data", total energy consumption
https://www.eia.gov/international/data/world
6. International Risk Governance Council (2012) The Rebound Effect: Implications of Consumer Behaviour for Robust Energy Policies.
http://www.irgc.org/issues/energy-efficiency/
7. U.S. EIA (2025) Total energy flow 2024
https://www.eia.gov/totalenergy/data/flow-graphs/total-energy.php
8. U.S. EIA (2025) Annual Energy Outlook 2025
https://www.eia.gov/outlooks/aeo/tables_ref.php
9. Intergovernmental Panel on Climate Change (IPCC) (2023) Synthesis Report of the IPCC Sixth Assessment Report (AR6) Summary for Policy Makers.
https://www.ipcc.ch/report/ar6/syr/
10. U.S. EIA (2024) "How much petroleum does the US import and export-FAQ."
https://www.eia.gov/tools/faqs/faq.php?id=727&t=6
11. Alvarez, R. et al. (2018) Assessment of methane emissions from the U.S. oil and gas supply chain. Science, 361(6398): 186-188.
https://science.sciencemag.org/content/361/6398/186
12. Intergovernmental Panel on Climate Change (2021) Climate Change 2021: The Physical Science Basis.
https://www.ipcc.ch/report/ar6/wg1/
13. U.S. EPA (2024) Inventory of U.S. Greenhouse Gas Emissions and Sinks: 1990-2022
https://www.epa.gov/ghgemissions/inventory-us-greenhouse-gas-emissions-and-sinks-1990-2022
14. Friedlingstein et al. (2023) Global Carbon Budget 2023. Earth System Science Data.
https://globalcarbonatlas.org/emissions/carbon-emissions/
15. U.S. EIA (2020) "Renewable Energy and the Environment."
https://www.eia.gov/energyexplained/
16. American Council for an Energy-Efficient Economy (2019) Halfway There: Energy Efficiency Can Cut Energy Use and Greenhouse Gas Emissions in Half by 2050.
https://www.aceee.org/research-report/u1907
17. U.S. EIA (2024) Preliminary Monthly Electric Generator Inventory April 2024
https://www.eia.gov/electricity/data.php#gencapacity
18. U.S. DOE (2015) Wind Vision Report: Report Highlights.
http://www.energy.gov/windvision
19. U.S. DOE (2012) SunShot Vision Study.
https://www1.eere.energy.gov/solar/pdfs/47927.pdf
20. COP28, UAE (2023) GLOBAL RENEWABLES AND ENERGY EFFICIENCY PLEDGE
https://www.cop28.com/en/global-renewables-and-energy-efficiency-pledge
21. Climate Watch (2025) Net Zero Tracker
https://www.climatewatchdata.org/net-zero-tracker
22. IEA (2023) Fossil Fuel Subsidies in Clean Energy Transitions: Time for a New Approach?
23. IMF (2023) IMF Fossil Fuel Subsidies Data: 2023 Update
24. Joint Committee on Taxation (2024) Estimates of Fed. Tax Expenditures for Fiscal Years 2024-2028.
https://www.jct.gov/publications/2024/jcx-48-24/
25. Bird, L., et al. (2008) "Implications of carbon cap-and-trade for U.S. voluntary renewable energy markets." Energy Policy, 36(6): 2063-2073.
http://www.sciencedirect.com/science/article/pii/S0301421508000761
26. Congressional Research Service (2020) The Renewable Electricity Production Tax Credit: In Brief.
https://fas.org/sgp/crs/misc/R43453.pdf
27. EPA (2023) "Summary of Inflation Reduction Act Provisions Related to Renewable energy."
28. US Energy Star (2024) Federal Tax Credits for Energy Efficiency
https://www.energystar.gov/about/federal-tax-credits#homeowners
29. U.S. DOT & IRS (2024) Department of Treasury and IRS release Inflation Reduction Act clean energy statistics
30. DSIRE (2025) U.S. Summary Maps: Renewable and Clean Energy Standards.
https://ncsolarcen-prod.s3.amazonaws.com/wp-content/uploads/2025/04/RPS-CES-April2025.pdf
31. Barbose, G. (2023) U.S. Renewables Portfolio Standards 2023 Status Update PowerPoint Presentation (live-etabiblio.pantheonsite.io)
32. Congressional Research Service (2020) Electricity Portfolio Standards: Background, Design Elements, and Policy Considerations.
https://fas.org/sgp/crs/misc/R45913.pdf
33. DSIRE (2024) Glossary
https://www.dsireusa.org/support/glossary/
34. SEIA (2025) "The Clean Energy Provisions in the One Big Beautiful Bill.”
https://seia.org/research-resources/clean-energy-provisions-big-beautiful-bill
35. U.S. EIA (2024) “International Energy Data"
36. The White House (2025) Unleashing American Energy
https://www.whitehouse.gov/presidential-actions/2025/01/unleashing-american-energy/
37. U.S. DOE (2025) Renewable Energy Pillar
https://www.energy.gov/eere/renewable-energy-pillar
38. U.S. DOE (2022) Renewable Energy Resource Assessment Information for the United States
https://www.energy.gov/eere/analysis/renewable-energy-resource-assessment-information-united-states
39. U.S. DOE, EERE (2023) “Federal Tax Credits for Plug-in Electric and Fuel Cell Electric Vehicles Purchased in 2023 or After.”
https://www.fueleconomy.gov/feg/taxevb.shtml
40. Electrification Coalition (2025) EV and Charging Tax Credits After the One Big Beautiful Bill Act