Hydrogen Factsheet
Hydrogen is a feedstock and energy carrier used in multiple sectors. Global hydrogen demand reached 97 Mt in 2023, a 2.5% increase from 2022, with 10 Mt in the U.S.1,2 Hydrogen is the most abundant element in the universe, but is present in limited amounts in elemental form on Earth. The primary production method (globally and in the U.S.) is steam methane reforming (SMR) of natural gas (NG), which produces CO₂ emissions. Another method, electrolysis, uses electricity to split water into hydrogen and oxygen, offering a decarbonization pathway when powered by zero- or low-carbon sources like renewables or nuclear power. Hydrogen can play a key role in decarbonizing end-use applications where alternatives like electrification are problematic.2
- Hydrogen has the highest energy per mass of any fuel at 120 MJ/kg H₂ on a lower heating value basis, but very low volumetric energy density of 8 MJ/L for liquid hydrogen and 5.6 MJ/L for compressed hydrogen gas at 700 bar pressure, compared to 32 MJ/L for gasoline at ambient conditions.3,4
- Hydrogen can be stored as high-pressure gas or low-temperature liquid.3
- Demand for low-emissions hydrogen grew almost 10% in 2023 but remains below 1% of global H₂ demand.1 Global demand could reach 150M t by 2030, with 45% from low-emissions sources.1
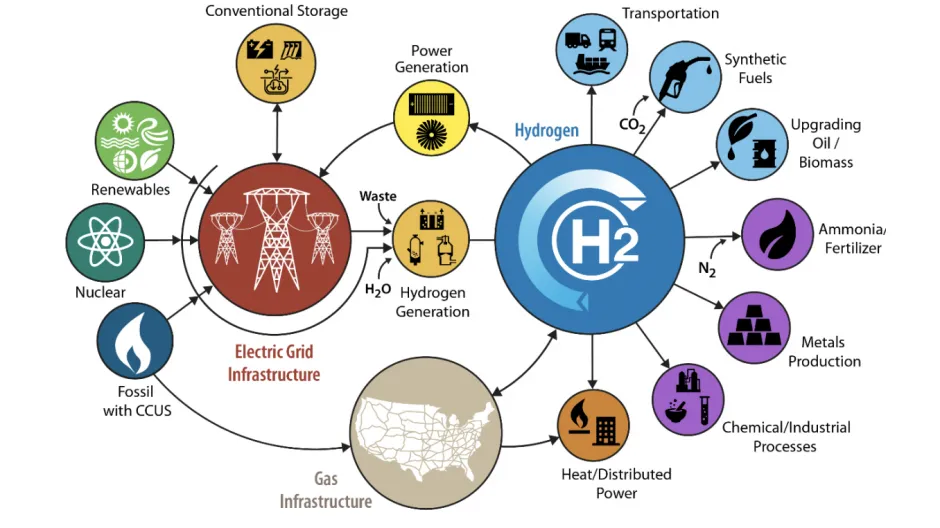
U.S. DOE H2@Scale Diagram5
Hydrogen Technologies and Impacts
Production
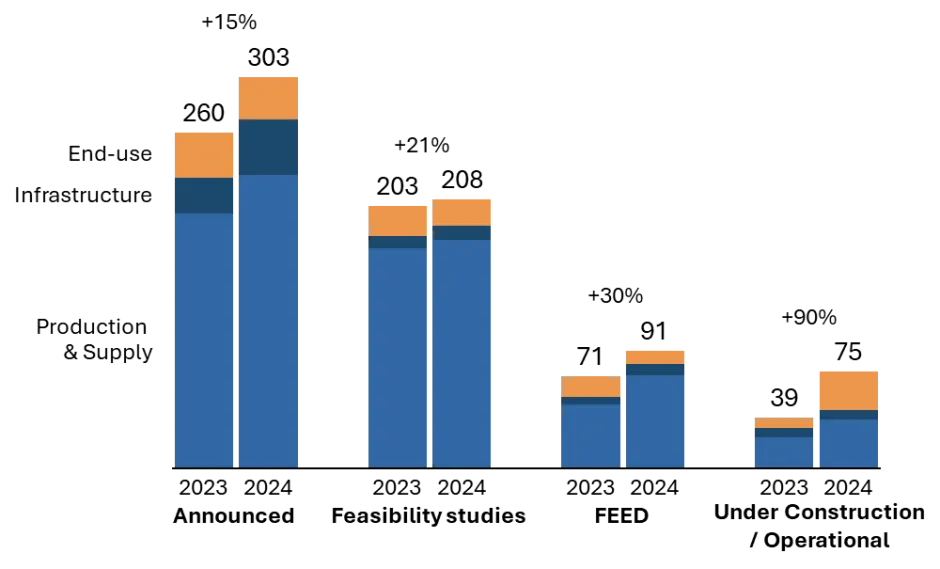
- Globally, 1,572 clean hydrogen projects have been announced as of May 2024. Of these, 1,125 have planned operation dates through 2030, representing $680B in investments.7 China ($31B) and North America ($17B) contribute over 60% of investments for projects under construction or operational.7
- Hydrogen can be produced via SMR, electrolysis of water, and gasification of coal or biomass.6
Hydrogen Investments until 2030 (US$Billion)7
- In SMR, NG reacts with high-temperature steam to produce hydrogen and synthesis gas containing CO and CO₂.8 The “water-gas shift reaction” converts CO and steam over a catalyst to produce additional hydrogen and CO₂.8
- SMR is the least expensive ($1-2/kg H₂) and most widely used method,6,9 accounting for 95% of hydrogen production at large U.S. central plants.8 SMR emits 7-10 kg CO₂/kg H₂.10
- Alkaline and proton exchange membrane (PEM) electrolyzers are commercially available, while solid oxide electrolyzer cell (SOEC) and anion exchange membrane (AEM) electrolyzers are maturing.11
- Green hydrogen production cost $7.5/kg H₂ in 2020. The U.S. Department of Energy (DOE) targets $2/kg H₂ by 2026 and $1/kg H₂ by 2031.5
- In the U.S., hydrogen prices vary by end-use, with an average market price of $7.12/M Btu but reaching $60.48/M Btu in the transportation sector.12
- The current grid mix is not ideal for electrolysis as 60% of U.S. electricity comes from fossil fuels,13 resulting in a CO₂ intensity of 20-25 kg CO₂/kg H₂.5
Distribution and Storage
- Hydrogen in the U.S. is produced at or near where it will be used, reflecting transportation challenges.6 Hydrogen can be transported via pipeline or over the road using liquid tanker or tube trailer trucks.14
- Pipelines are the least expensive delivery method at $0.2-0.5/kg H₂, with approximately 1,600 mi of pipeline in the U.S.6,15 Tube trailers transport compressed hydrogen, typically used for distances under 200 mi, but cost $0.9-1.9/kg H₂.6,15
- Liquid tankers are better suited for transporting larger amounts over longer distances but are more expensive at $2.7-3.2/kg H₂ due to energy and equipment requirements for liquefaction.6,15
- Storage of hydrogen as a compressed gas typically requires high-pressure tanks at 350-700 bar (atmospheric pressure is 1.013 bar).3
- Liquid storage achieves greater densities than compressed gas but is more energy intensive and requires extremely low temperatures as hydrogen’s boiling point is −253 °C (−423 °F).3,16
- Underground hydrogen storage may be possible. Conventional options include salt caverns, while proposed sites include abandoned coal mines and refrigerated mined caverns.17
U.S. Projected Hydrogen Supply by Source12

End-Uses
- Refining is the largest U.S. end use of hydrogen at 5.5 Mt in 2021, followed by ammonia synthesis at 3.5 Mt. Other uses include methanol production and direct reduction of iron (DRI) in steelmaking, which requires 47-68 kg H₂/t.5,9
- A potential application for hydrogen is synfuel production through reacting hydrogen with CO₂. When atmospheric CO₂ is used, the carbon in fuel is considered net zero in emissions, though CO₂ capture process emissions may still occur.19
- Blending hydrogen with NG could result in rapid demand increase. Preliminary estimates say hydrogen can be injected into NG pipelines up to 20% by volume, though co-firing with NG reduces GHG emissions only 6-7%.19,20
- Hydrogen burners are currently under development to replace NG and other fossil fuels in industrial heating for cement clinker kilns, glass furnaces, aluminum remelting furnaces, metal rolling, and heat treatment furnaces.
- Hydrogen can be used in residential buildings to power fuel cell combined heat and power (CHP) systems, direct flame combustion boilers, catalytic boilers, and gas-powered heat pumps. Larger district heat and CHP devices using NG could be redesigned for hydrogen.21
- Transportation uses include direct or indirect application in conventional and synfuels across all transport modes. Global refining used 43 Mt H₂ in 2023, over 700 times the direct use as transportation fuel.1
- U.S. hydrogen transportation includes over 50k fuel cell forklifts, nearly 50 retail fueling stations, over 80 fuel cell buses, and more than 15k fuel cell vehicles.5
- Hydrogen is not well-suited for light-duty vehicles, but is expected to decarbonize heavy-duty transport where storing large amounts of energy and rapid refueling are challenging for electric vehicles.2
- Achieving net-zero emissions by 2050 requires an 80-fold growth in new end-uses by 2030, reaching 40% of demand.1
Environmental Impacts
- CO₂ emissions from hydrogen production and use increased to 920 Mt in 2023.1
- Environmental concerns include NOx emissions from high-temperature combustion,23methane leakage from blue hydrogen production,24, 25, 26 and atmospheric reactions with greenhouse gases (e.g., CH4, O3, H20) leading to positive radiative forcing.27
- Climate benefits depend on the specific use case, production method, hydrogen and methane emission rates, renewable electricity availability, and time scale.24
- Global warming potential for hydrogen ranges from 4-12.8.27
- Green hydrogen production using renewable electricity is estimated to reduce warming by 66-95% relative to displaced fossil fuel technologies.24
- Electrolysis represents less than 5% of worldwide hydrogen production but offers a pathway to zero-carbon emissions.28
- Water requirements for electrolysis are 9 kg H₂O/kg H₂ on a stoichiometric basis,29 increasing to 15-20 kg H₂O/kg H₂ when accounting for electricity generation.30
- The water required to produce 800 Mt of hydrogen for a net zero economy in 2050 would be much less than current fossil fuel extraction and processing needs, accounting for 0.7% of global freshwater use.30 Desalination would add approximately $0.02/kg to hydrogen prices from salt water.30
U.S. Hydrogen Strategy and Policy
- Government action has intensified through implementation of mandates, incentive schemes, and market development.1
- The Infrastructure Investment and Jobs Act provided $9.5B for hydrogen,31 including $7B to the Regional Clean Hydrogen Hubs Program to form the foundation of a national clean hydrogen network.32
- The DOE’s National Clean Hydrogen Strategy and Roadmap explores pathways for clean hydrogen to aid decarbonization across the economy.5
- The Inflation Reduction Act offers up to 30% Investment Tax Credit and $3/kg H₂ Production Tax Credit for clean hydrogen production through 2027, plus up to $85/ton for low-carbon hydrogen through 2032.31
- The U.S. Federal Highway Administration designated a national network of electric vehicle charging and hydrogen, propane, and NG fueling infrastructure along interstate highway corridors.33
U.S. Projected Hydrogen Demand by End Use12

IRA Tax Credits for Hydrogen31
Center for Sustainable Systems, University of Michigan. 2025. “Hydrogen Factsheet.” Pub. No. CSS23-07.
References
1. IEA (2024) Global Hydrogen Review 2024
https://www.iea.org/reports/global-hydrogen-review-2024
2. Center for Sustainable Systems (CSS) (2022) MI Hydrogen Roadmap Workshop Report.
3. U.S. Department of Energy (DOE) Hydrogen Storage.
https://www.energy.gov/eere/fuelcells/hydrogen-storage
4. Møller, Kasper T., et al. (2017) Hydrogen-A sustainable energy carrier.
https://www.sciencedirect.com/science/article/pii/S1002007116303240
5. U.S. Department of Energy (DOE) U.S. National Clean Energy Strategy and Roadmap.
https://www.hydrogen.energy.gov/clean-hydrogen-strategy-roadmap.html
6. U.S. DOE (2023) Hydrogen Production and Distribution.
https://afdc.energy.gov/fuels/hydrogen_production.html
7. Hydrogen Council, McKinsey & Company (2024) Hydrogen Insights 2024
https://hydrogencouncil.com/en/hydrogen-insights-2024/
8. U.S. DOE (2023) Hydrogen Production: Natural Gas Reforming.
https://www.energy.gov/eere/fuelcells/hydrogen-production-natural-gas-reforming
9. IEA (2019) The Future of Hydrogen.
https://www.iea.org/reports/the-future-of-hydrogen
10. Sun, P., et al. (2019) Criteria Air Pollutants and Greenhouse Gas Emissions from Hydrogen Production in U.S. Steam Methane Reforming Facilities.
https://greet.es.anl.gov/publication-cap_ghg_h2_smr
11. IEA (2022) Electrolysers Technology deep dive.
https://www.iea.org/reports/electrolysers
12. U.S. EIA (2025) Annual Energy Outlook 2025 Table 19
https://www.eia.gov/outlooks/aeo/index.php
13. U.S. EIA (2023) Annual Energy Outlook 2023.
https://www.eia.gov/outlooks/aeo/narrative/index.php#TheElectricityMixinth
14. U.S. DOE (2023) Hydrogen Delivery.
https://www.energy.gov/eere/fuelcells/hydrogen-delivery
15. U.S. DOE (2023) Pathways to Commercial Liftoff: Clean Hydrogen.
https://liftoff.energy.gov/wp-content/uploads/2023/05/20230320-Liftoff-Clean-H2-vPUB-0329-update.pdf
16. Dalebrook, A., et al. (2013) Hydrogen storage: beyond conventional methods
https://pubs.rsc.org/en/content/articlelanding/2013/cc/c3cc43836h
17. Muhammad, N., et al (2021) A review on underground storage: Insight into geological sites, influencing factors and future outlook
https://www.sciencedirect.com/science/article/pii/S2352484721014414
19. Elgowainy, A., et al (2022) Assessment of Potential Future Demands for Hydrogen in the United States.
https://www.osti.gov/biblio/1710201/
20. Baldwin, S., et al (2022) Assessing the Viability of Hydrogen Proposals: Considerations for State Utility Regulators and Policymakers.
21. Dobbs, P., et al (2014) Hydrogen and fuel cell technologies for heating a review.
https://www.sciencedirect.com/science/article/pii/S0360319914031383
22. Columbia University SIPA (2025) Assessing the Energy Impacts of the One Big Beautiful Bill Act
https://www.energypolicy.columbia.edu/assessing-the-energy-impacts-of-the-one-big-beautiful-bill-act
23. U.S. DOE (2024) Does the use of hydrogen produce air pollutants such as nitrogen oxides?
https://www.energy.gov/eere/fuelcells/does-use-hydrogen-produce-air-pollutants-such-nitrogen-oxides
24. Sun, Tianyi, et al.(2024) Climate Impacts of Hydrogen and Methane Emissions Can Considerably Reduce the Climate Benefits across Key Hydrogen Use Cases and Time Scales.
https://pubs.acs.org/doi/10.1021/acs.est.3c09030
25. Howarth, R. W., & Jacobson, M. Z. (2021). How green is blue hydrogen?
https://scijournals.onlinelibrary.wiley.com/doi/full/10.1002/ese3.956
26. Romano, Matteo C., et al. (2022) Comment on “How green is blue hydrogen?”
https://scijournals.onlinelibrary.wiley.com/doi/full/10.1002/ese3.1126
27. Sand, Maria, et al. (2023) A multi-model assessment of the Global Warming Potential of hydrogen.
https://www.nature.com/articles/s43247-023-00857-8
28. Osman, A. et al. (2022) Hydrogen production, storage, utilisation and environmental impacts: a review
https://link.springer.com/article/10.1007/s10311-021-01322-8
29. Beswick, R., et al (2021) Does the Green Hydrogen Economy Have a Water Problem.
https://pubs.acs.org/doi/10.1021/acsenergylett.1c01375
30. Energy Transitions Commission (2021) Making the Hydrogen Economy Possible: Accelerating Clean Hydrogen in an Electrified Economy.
https://www.energy-transitions.org/publications/making-clean-hydrogen-possible/
31. Resources for the Future (2022) Incentives for Clean Hydrogen Production in the Inflation Reduction Act.
32. U.S. DOE (2023) Regional Clean Energy Hubs.
https://www.energy.gov/oced/regional-clean-hydrogen-hubs
33. U.S. DOE (2021) National Alternative Fuels Corridors.