Wind Energy Factsheet
Wind Resources and Potential
Approximately 2% of solar energy striking Earth’s surface is converted into kinetic energy in wind.1 Wind turbines convert this kinetic energy to electricity without emissions,1 and can be built onshore or offshore.2 Wind power is proportional to the cube of wind speed; high wind speeds yield more energy.4 Average annual wind speeds of 6.5 m/s or greater at 80m height are considered commercially viable, though new technologies are expanding the wind resources accessible for commercial projects.5 In 2024, wind generated 11% of U.S. electricity.6
U.S. Wind Resources (80m height)3
Image
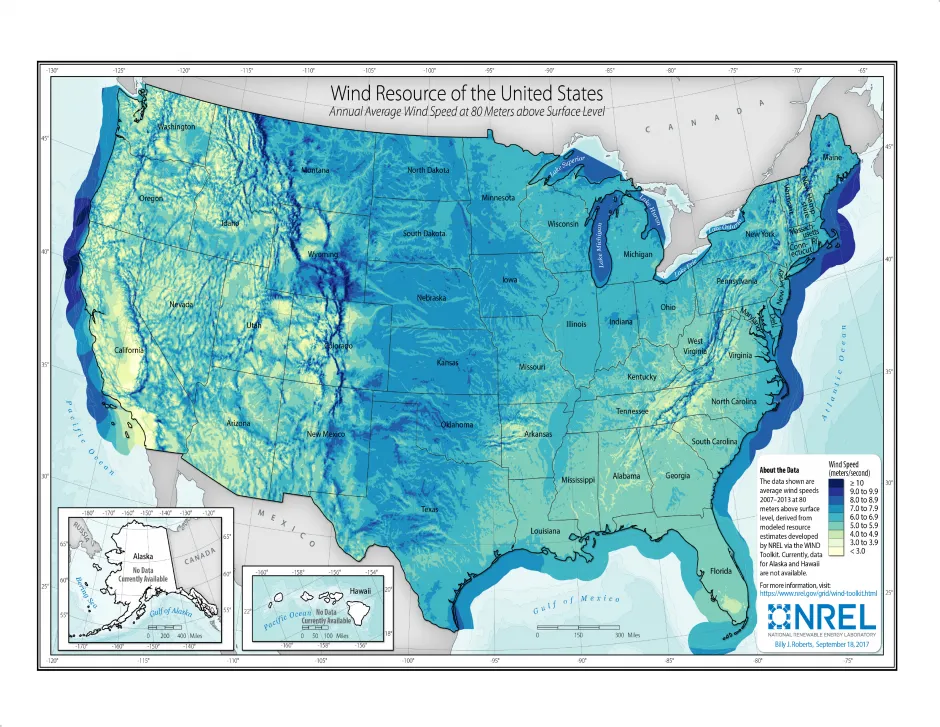
- Wind speeds increase with height above the Earth’s surface. Average hub height is 103m for U.S. onshore wind turbines,7 and 124m for global offshore turbines.8
- Global onshore and offshore wind generation potential at 90m turbine hub heights could provide 872,000 TWh of electricity annually,9 over 30 times the 27,081 TWh used globally in 2023.10 Continental U.S. wind potential of 43,000 TWh/yr9 exceeds 2024 U.S. electricity use of 4,100 TWh.6
- Wind could provide 20% of U.S. electricity by 2030 and 35% by 2050.11 Five of the eight Great Lakes states have offshore wind energy potentials that exceed their annual electricity demand (MI, WI, NY, OH, MN). Michigan’s offshore resource could supply over 18 times its 2020 demand.12
Wind Technology and Impact
Horizontal Axis Wind Turbines
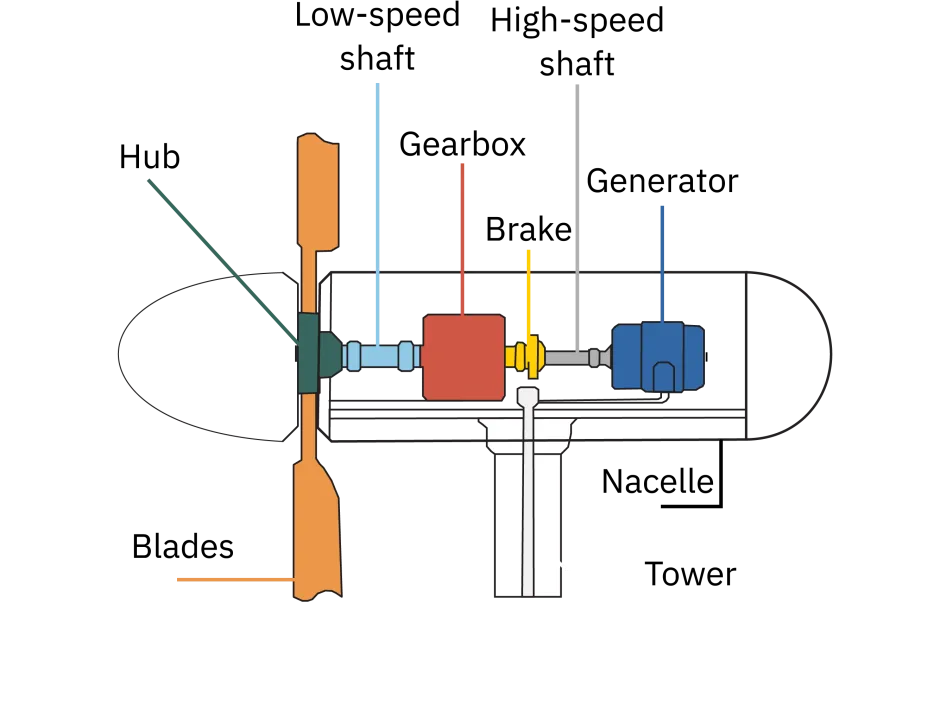
- Horizontal axis wind turbines (HAWT) are the predominant design, featuring blades (usually three) symmetrically mounted to a hub connected via a shaft to a gearbox and generator. The nacelle houses these components atop a tower.13
- HAWT range from 2.5 m diameter and 1 kW for residential to 100+ m diameter and 10+ MW for offshore applications. The theoretical maximum efficiency of a turbine (Betz Limit) is 59%. Most turbines extract ~50% of wind energy.11
Horizontal Axis Wind Turbine Diagram13
Image
- Capacity factor—average power output divided by maximum capability—11 ranges from 5-50% for U.S. onshore turbines, averaging 38%.7
- Curtailment is a reduction in generator output below full potential due to supply-demand mismatches.15 U.S. wind curtailment averaged 4.6% in 2023, down from 11.1% in 2009 but up from 2.1% in 2016.15 Rates were highest in the Southwest Power Pool (8.3%) and lowest in the Pennsylvania-New Jersey-Maryland Interconnection (0.1%).7
- Offshore winds are stronger than onshore, yielding higher capacity factors (estimated 60% for new projects by 2050),16,17 but offshore facilities cost more to build and maintain.18
- Current offshore turbines operate in depths up to 40-50m,19 but floating technologies could expand generation, as 58% of U.S. technical wind resources lie in waters deeper than 60m.20
Installation, Manufacturing, and Cost
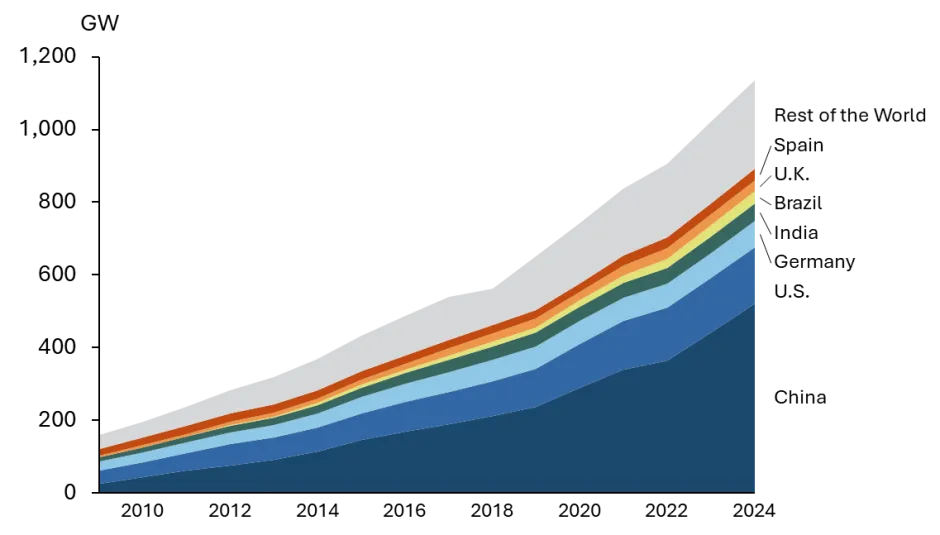
- Global wind capacity increased 11% annually over the last decade, reaching 1,136 GW in 2024. China led in new and cumulative capacity, followed by the U.S. and Germany.21
- Wind supplies 57% of Denmark’s electricity generation and over 20% in ten other countries.7
- Global wind additions reached a record 117 GW in 2023.7 In 2024, onshore installations surpassed 100 GW for the second consecutive year, while the U.S. experienced a slowdown. Offshore additions totaled 8 GW worldwide—a 26% decrease from 2023—bringing global offshore capacity to 83.2 GW.21
- The U.S. commissioned the 132 MW South Fork Wind Farm, increasing total U.S. offshore capacity to 174 MW.21
- U.S. wind capacity grew from 45 GW in 2010 to 156 GW in 2024, an 11% average annual increase.22
- U.S. average onshore turbine size reached 3.4 MW in 2023, up 5% from 2022 and 375% since 1999.7 Fleet-wide capacity factor averaged 33.5% in 2023, with plants built in 2022 achieving 38.2%,7 compared to 31% for projects installed from 2004-2012.40
- Texas leads in installed wind capacity (41 GW), followed by Iowa (13 GW) and Oklahoma (12.6 GW).7 Texas (1,323 MW) and Illinois (928 MW) installed the most new wind capacity in 2023.7 Iowa generated 59% of its electricity from wind in 2023, while twelve states achieved at least 20%.7
- Wind project costs declined 71% from $5,326/kW in 1983 to $1,694/kW in 2023.7 The average levelized cost of energy (LCOE) for onshore projects fell to $49/MWh in 2022, down 58% since 2012.7
- Wind power purchase agreement (PPA) prices averaged 2.6¢/kWh in the U.S. in 2022.7 In 2023, PPA prices surged to 6¢/kWh in North America.7
- The installed cost of a small turbine (~100 kW) averaged $7,370/kW in 2023, 6% less than in 2022.25,39
- Large wind projects require ~85 acres per MW but occupy only 1% for infrastructure and equipment, leaving the remainder available for other uses.11
- The wind industry supports over 300,000 U.S. jobs and generates more than $2B in tax revenue.26
- For farmers, annual lease payments provide a stable income of around $3,000/MW of turbine capacity.11
Global Wind Capacity (GW)2
Image
Environmental Impacts
- U.S. wind energy generation avoids 351 Mt of CO₂ emissions annually.26 If 35% of U.S. electricity was wind-generated by 2050, the electricity sector would reduce GHG emissions by 23%, eliminate 510 Mt of CO2 emissions annually, and decrease water use by 15%.11
- Annual avian mortality from collisions with turbines is 0.2M, compared to 130M due to power lines and 300-1,000M from buildings. Careful siting can minimize mortality.11
- Bat mortality due to wind turbines is less studied, with many collisions occurring among migratory species during summer and fall months.11, 28 The wind industry is testing methods that could reduce bat mortality by over 50%.11
- Noise levels at a 350m distance from a typical wind farm is 35-45 dB—comparable to a quiet bedroom (35 dB) and quieter than a car traveling 40 mph at 100m distance (55 dB).29 Multiple studies through 2013 conclusively determined that wind turbine sound has no impact on human health.11
- Over 2 Mt of wind turbine blades are expected to be retired in the U.S. by 2050.
- While current landfilling costs are relatively low, improved design, materials, recycling technology, and waste management policies are needed to enhance blade end-of-life performance.30
Solutions and Sustainable Actions
- The Inflation Reduction Act of 2022 provides a 30% Investment Tax Credit and Production Tax Credit of 2.75¢/kWh for qualified wind systems through 2027.27,31
- Residential customers receive a 30% tax credit on qualified clean energy equipment, including wind turbines, installed through September 2025.27,32
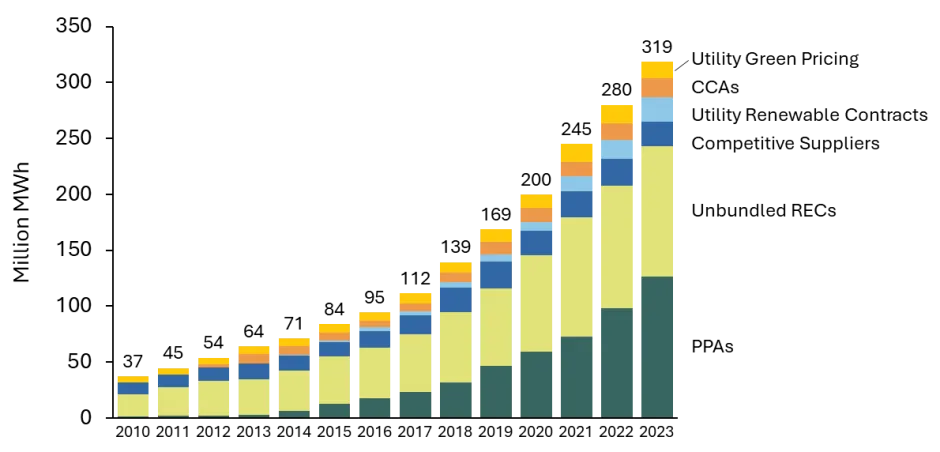
- Customers can purchase renewable energy through unbundled renewable energy certificates (RECs), community choice aggregations (CCAs), and power purchase agreements (PPAs). In 2023, 9.7M customers procured 310 TWh of renewable energy through the market, 44% of the U.S. non-hydro renewable energy generation.33
- Renewable energy producers sell RECs in addition to the electricity they produce; for a few cents per kWh, customers purchase RECs to “offset” their electricity use emissions.34
- CCA programs enable local governments to procure power for residents, businesses, and municipal accounts from alternative suppliers while maintaining existing utility transmission and distribution. CCAs are authorized in 10 states (CA, IL, MA, MD, NH, NJ, NY, OH, RI, VA).35
- Microsoft, Google, and T-Mobile were the top three corporate buyers of green power in 2024.36
- Among universities, University of California, University of Iowa, and Arizona State led green power use, with University of Iowa obtaining 84% of electricity from green sources in 2024. University of Michigan ranked 12th, using green power for 18% of electricity, while at least six universities achieved 100% green power.23
- Customers can self-supply renewable electricity by owning on- or off-site renewable equipment connected through the grid.37
- Make your lifestyle more efficient to reduce the amount of energy you use
Voluntary Sales by Customers, 2010-202333
Image
U.S. Average Unsubsidized Levelized Cost of Energy (LCOE) for On-Shore Wind
Global Wind Capacity (GW)20
Cite As
Center for Sustainable Systems, University of Michigan. 2025. "Wind Energy Factsheet." Pub. No. CSS07-09.
References
- Gustavson, M. (1979) "Limits to Wind Power Utilization." Science, 204(4388): 13-17. http://www.jstor.org/stable/pdf/1747950.pdf?_=1462810374535
- U.S. DOE (2024) How Do Wind Turbines Works https://www.energy.gov/eere/wind/how-do-wind-turbines-work
- U.S. Department of Energy (DOE), National Renewable Energy Lab (NREL) (2017) U.S. Wind Resource Map. https://www.nrel.gov/gis/wind-resource-maps
- Massachusetts Institute of Technology (2010) Wind Power Fundamentals. http://web.mit.edu/windenergy/windweek/Presentations/Wind%20Energy%20101.pdf
- U.S. DOE, Energy Efficiency and Renewable Energy (EERE) (2020) “U.S. Average Annual Wind Speed at 80 Meters.” https://www.eia.gov/todayinenergy/detail.php?id=4630
- U.S. Energy Information Administration (EIA) (2025) Monthly Energy Review June 2025 https://www.eia.gov/totalenergy/data/monthly/
- U.S. Department of Energy (DOE) (2024) Land-Based Wind Market Report 2024 Edition https://emp.lbl.gov/wind-technologiesmarket-report
- U.S. Department of Energy (DOE) (2024) Offshore Wind Market Report 2024 Edition https://www.energy.gov/eere/wind/offshore-wind-market-report
- NREL (2017) An Improved Global Wind Resource Estimate for Integrated Assessment Models. https://www.nrel.gov/docs/fy17osti/65323.pdf
- U.S. EIA (2025) International Energy Statistics: Total Electricity Net Consumption. https://www.eia.gov/international/data/world/electricity/electricity-consumption?pd=2&p=0000002&u=0&f=A&v=mapbubble&a=-&i=none&vo=value&t=C&g=00000000000000000000000000000000000000000000000001&l=249-ruvvvvvfvtvnvv1vrvvvvfvvvvvvfvvvou20evvvvvvvvvvnvvvs0008&s=315532800000&e=1672531200000
- U.S. DOE (2015) Wind Vision Report. http://energy.gov/sites/prod/files/2015/03/f20/wv_full_report.pdf
- NREL (2023) Great Lakes Wind Energy Challenges and Opportunities Assessment. https://www.nrel.gov/docs/fy23osti/84605.pdf
- U.S. DOE, Wind Energy Technologies Office (2023) “How a Wind Turbine Works - Text Version” https://energy.gov/eere/wind/inside-wind-turbine-0
- "NREL (2014) Wind and Solar Energy Curtailment: Experience and
Practices in the United States" https://www.nrel.gov/docs/fy14osti/60983.pdf - U.S. DOE, NREL (2015) “Transparent Cost Database: Capacity Factor” Open Energy Information. https://www.nrel.gov/analysis/tech-cap-factor.html
- International Renewable Energy Agency (2019) Future of Wind Executive Summary. https://irena.org/-/media/Files/IRENA/Agency/Publication/2018/Sep/IRENA_offshore_wind_brief_G7_2018.pdf
- NREL (2022) 2021 Cost of Wind Energy Review. https://www.osti.gov/biblio/1907623
- International Renewable Energy Agency (2018) Offshore Innovation Widens Renewable Energy Options. https://irena.org/-/media/Files/IRENA/Agency/Publication/2018/Sep/IRENA_offshore_wind_brief_G7_2018.pdf
- U.S. DOE, NREL (2016) 2016 Offshore Wind Energy Resource Assessment for the United States. https://www.nrel.gov/docs/fy16osti/66599.pdf
- Global Wind Energy Council (GWEC) (2025) Global Wind Report 2025. https://gwec.net/wp-content/uploads/2024/05/GWR-2024_digital-version_final-2.pdf
- U.S. EIA (2025) Preliminary Monthly Electric Generator Inventory June 2025 https://www.eia.gov/electricity/data/eia860m/
- U.S. EPA (2024) “Green Power Partnership Top 30 College and University https://www.epa.gov/greenpower/green-power-partnership-top-30-college-university
- S&P Global (2024) North American solar, wind power prices continued ascent in 2023 – report https://www.spglobal.com/marketintelligence/en/news-insights/latest-news-headlines/north-american-solar-wind-power-prices-continued-ascent-in-2023-8211-report-80219261#:~:text=Solar%20power%20purchase%20agreement%20%28PPA%29%20prices%20on%20average,Inc.%20data%20released%20in%20a%20Jan.%2030%20report.
- U.S. DOE, Pacific Northwest National Lab (PNNL) (2025) Distributed Wind Market Report 2024 Edition https://www.pnnl.gov/distributed-wind/market-report
- ACP (2025) "Wind Power Facts." https://cleanpower.org/facts/wind-power/
- SEIA (2025) "The Clean Energy Provisions in the One Big Beautiful Bill.” https://seia.org/research-resources/clean-energy-provisions-big-beautiful-bill
- U.S. Geological Survey, Fort Collins Science Center (2016) “Bat Fatalities at Wind Turbines: Investigating the Causes and Consequences.” https://www.usgs.gov/centers/fort/science/bat-fatalities-wind-turbines-investigating-causes-and-consequences?qt-science_center_objects=0#qt-science_center_objects
- U.S. DOE, EERE (2008) 20% Wind Energy by 2030: Increasing Wind Energy’s Contribution to U.S. Electricity Supply. https://www.nrel.gov/docs/fy08osti/41869.pdf
- Cooperman, A., Eberle, A., & Lantz, E. (2021). Wind Turbine Blade Material in the United States: Quantities, Costs, and End-of-Life Options https://pdf.sciencedirectassets.com/271808/1-s2.0-S0921344921X0002X/1-s2.0-S092134492100046X/main.pdf?X-Amz-Security-Token=IQoJb3JpZ2luX2VjEMb%2F%2F%2F%2F%2F%2F%2F%2F%2F%2FwEaCXVzLWVhc3QtMSJGMEQCICZEHXPQAIRvDumpJFWXXQTofzcWfFMvKf0EZ8691F6aAiARhm%2BurpRI1z
- U.S. DOE (2023) Federal Solar Tax Credits for Businesses https://www.energy.gov/eere/solar/federal-solar-tax-credits-businesses
- IRS (2024) Residential Clean Energy Credit https://www.irs.gov/credits-deductions/residential-clean-energy-credi
- "NREL (2024) The State of the U.S. Voluntary Green Power Market (2023 Data)" https://www.nrel.gov/analysis/green-power
- U.S. EPA (2019) “Renewable Energy Certificates 101: Market Instruments and Claims." https://www.epa.gov/sites/default/files/2020-06/documents/3.0b-solar-claims-and-renewable-energy-certificates.pdf
- EPA (2024) Community Choice Aggregation https://www.epa.gov/green-power-markets/community-choice-aggregation
- U.S. EPA (2024) “Green Power Partnership National Top 100.” https://www.epa.gov/greenpower/green-power-partnership-national-top-100
- U.S. EPA (2023) Green Power Supply Options https://www.epa.gov/green-power-markets/green-power-supply-options
- NREL (2023) Status and Trends in the Voluntary Market (2022 Data) https://www.nrel.gov/docs/libraries/analysis/status-and-trends-2022-data.pdf?sfvrsn=d99d2351_2
- U.S. DOE, Pacific Northwest National Lab (PNNL) (2024) Distributed Wind Market Report 2023 Edition https://www.pnnl.gov/distributed-wind
- U.S. Department of Energy (DOE) (2023) Land-Based Wind Market Report 2023 Edition https://emp.lbl.gov/wind-technologies-market-report