U.S. Renewable Energy Factsheet
While energy is essential to modern society, most primary sources are non-renewable. The current fuel mix causes multiple environmental impacts, including climate change, acid rain, freshwater depletion, hazardous air pollution, and radioactive waste. Renewable energy can meet demand with a much smaller environmental footprint and improve energy security and other issues through distributed and diversified energy infrastructure.
U.S. Renewable Energy Use (Quads)1
- 82% of U.S. energy comes from fossil fuels, 8.7% from nuclear, and 9.1% from renewable sources. In 2023, renewables surpassed coal in energy generation.1
- Wind and solar are the fastest growing renewable sources, but contribute less than 3% of total energy used in the U.S.1
- The U.S. has an estimated 463,400 TWh of renewable energy technical potential—over 100 times the electricity consumed in 2020—, but less than 1% of this is utilized.11
- Levelized Cost of Energy (LCOE), measured as lifetime costs divided by energy production, remains lower for utility-scale solar and onshore wind than fossil fuels through 2025, despite slight increases in renewable LCOE during 2023 and 2024.2
Average Unsubsidized LCOE in the U.S. ($/MWh)2
Major Renewable Sources
Wind (See Wind Energy Factsheet)
- U.S. onshore wind resources have 9,124 GW of potential capacity,4 and 150 GW currently installed.5 Offshore wind resources have 4,249 GW of potential,6 with 174 MW currently installed, and the development pipeline contains over 80,000 MW of projects as of 2024.7
- Global wind additions reached a record 117 GW in 2023, totaling 1,021 GW. The U.S. remained the second-leading market in annual and cumulative capacity, well behind China.5
- U.S. wind installations dropped to 6.5 GW in 2023, the lowest since 2014, due to supply chain pressures, higher interest rates, interconnection and siting challenges, and the reduction of the Production Tax Credit (PTC).5
- The PTC has significantly influenced wind development, but cycles of legislative enactment and expiration create year-to-year investment volatility.8
- Based on the average U.S. electricity fuel mix, a 1.88 MW wind turbine (U.S. average size in 2022) displaces 3,800 t of CO2 emissions per year.9 The U.S. DOE estimates that 404 GW of cumulative wind capacity by 2050 would meet 35% of U.S. electricity demand, and avoid 12.3 Gt of CO2 emissions, a 14% reduction from 2013.10
U.S. Wind Capacity (GW)3
Solar (See Solar PV Energy Factsheet)
- Over 7% of U.S. electricity comes from solar energy, nearly 8 times its share a decade ago.34 Solar capacity has grown at an average of 28% annually over the last decade, reaching 248 GW nationwide, enough capacity to power over 41M houses.13
- In 2024, a new solar project was installed every 54 seconds, totaling 5,561,319 solar energy systems in the U.S.12
- Solar has added the most generating capacity to the grid for the last five years. It accounted for 53% of new generating capacity in 2023, the first time in 80 years that a renewable energy resource was a majority of capacity additions.13
- Solar continued leading the energy transition in 2025, representing over 69% of new capacity in the first quarter.¹³
- 500 GW of new solar capacity will be installed by 2035.12
- The DOE’s SunShot Initiative aims to reduce solar energy prices 50% by 2030, projected to result in solar meeting 33% of U.S. electricity demand and reducing electricity sector GHG emissions by 18% by 2050.14
- The U.S. solar industry faces significant challenges from recent federal actions, including proposed changes to tax credits that would make them unusable for new projects and a policy shift toward fossil fuels.34
U.S. Solar Capacity (GWdc)11
Biomass (See Biofuels Factsheet)
- Biomass is derived from plant materials, including agriculture residues, forest resources, purpose-grown energy crops, urban wood waste, and food waste, that can be converted into fuels, energy, or chemicals.15
- In 2024, 36% of U.S. biomass energy use was from wood, mostly as pulp, paper, and paperboard industry waste products. Waste, such as municipal solid waste, landfill gas, sludge, and agricultural byproducts and other biomass, supplied an additional 8%.1
- Biomass has low net CO2 emissions compared to fossil fuels. At combustion, it releases CO2 it pulled from the atmosphere to grow. Emissions are associated with processing, and biomass can have high land use intensity. Willow biomass requires 121 acres of land to generate 1 GWh of electricity per year, higher than other renewable energy sources.16
- U.S. ethanol production is projected to decrease 1.7% annually from 44M gal/d in 2024 to 24M gal/d by 2050.1,17
Geothermal (See Geothermal Energy Factsheet)
- Hydrothermal resources (steam and hot water reservoirs) provide geothermal energy for electricity generation, primarily in the western U.S., Alaska, and Hawaii. Ground source heat pumps (GSHP) can be used almost anywhere to extract heat from shallow ground.18
- GSHP use has grown 3% annually, with over 1.7M units installed in the U.S.19 GSHPs have the potential to provide heating and cooling for 28M households by 2050.20
- As of 2022, the U.S. has over 23 geothermal district heating and cooling systems that supply buildings and industries through a local distribution network,21 with the economic potential for 17,500 systems by 2050.20
- The U.S. led the world in geothermal electricity capacity in 2022 with nearly 4 GW installed, 24% of the global total.21 U.S. geothermal electricity generation is projected to reach 56B kWh by 2050, up from 16B kWh in 2024.17
Hydroelectric
- U.S. net electricity generation from conventional hydropower peaked at 356 TWh in 1997, declining to 242 TWh in 2024.1
- Hydroelectricity is virtually emission-free, but CH4 and CO2 are emitted from decomposition of vegetation in reservoirs.22 Other environmental concerns include fish mortality, habitat degradation, and water quality impairment. “Fish-friendly” turbines and smaller dams mitigate some of these problems.23
U.S. Hydroelectric Power Production
Advancing Renewable Energy
- Renewable Portfolio Standards (RPS) and Clean Energy Standards (CES) are projected to support an additional 300 TWh of clean electricity by 2030.24 See U.S. Energy System Factsheet for a U.S. map of these policies by state.
- State governments also provide renewable energy incentives including rebate, grant, and loan programs; building energy and permitting standards; corporate tax deductions, property tax incentives, personal tax credits, and sales tax exemptions; and feed-in tariff (FIT), net metering, and property assessed clean energy (PACE) programs. Check the DSIRE database or contact your state energy agency to access these benefits.25
- Net metering—offered in 34 states, D.C., and 3 territories—allows customers to sell excess electricity back to the grid.26 Some states are changing rate structures to credit solar energy producers differently.27
- Feed-in tariffs (FIT) set minimum prices per kWh that utilities must pay renewable electricity generators.28 As of 2025, four states (CA, NY, IN, WA) have a FIT.29
- The Farm Bill’s Rural Energy for America Program (REAP) funds grants and loan guarantees for agricultural producers and rural small businesses to install renewable energy systems.30
- PACE programs allow property owners to finance solar installations through voluntary property tax assessments.31 Green banks—public, quasi-public, or nonprofit financing entities—leverage capital to support clean energy projects. As of 2021, there were 21 green banks in 16 states and DC.32
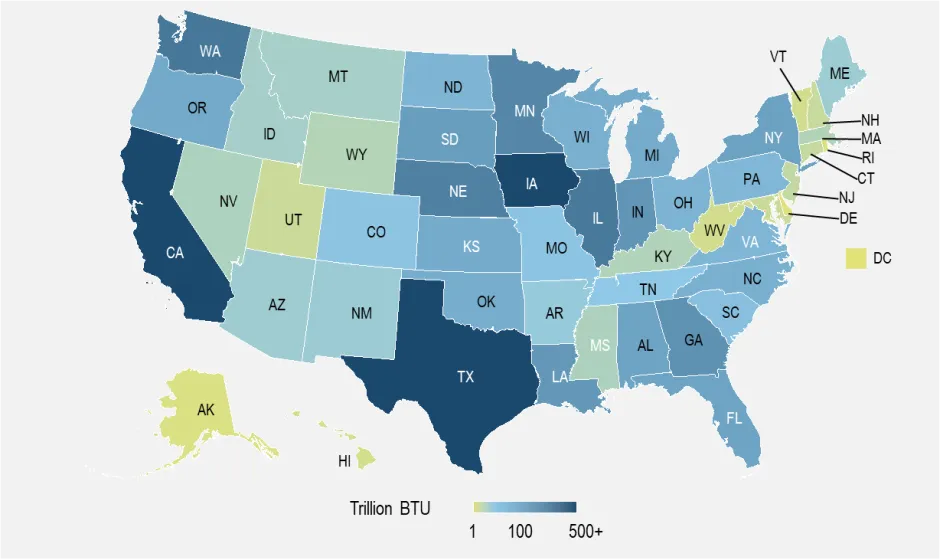
Renewable Energy Generation by State (BTU)35
Image
Cite As
Center for Sustainable Systems, University of Michigan. 2025. "U.S. Renewable Energy Factsheet." Pub. No. CSS03-12.
References
- U.S. Energy Information Administration (EIA) (2025) Monthly Energy Review June 2025 https://www.eia.gov/totalenergy/data/monthly/index.php
- Lazard (2025) Lazard’s 2025 LCOE Plus Report https://www.lazard.com/media/uounhon4/lazards-lcoeplus-june-2025.pdf
- U.S. EIA (2025) Preliminary Monthly Electric Generator Inventory June 2025 https://www.eia.gov/electricity/data/eia860m
- Lopez, A., et al. (2021) Land use and turbine technology influences on wind potential in the United States https://doi.org/10.1016/j.energy.2021.120044
- U.S. Department of Energy (DOE) (2024) Land-Based Wind Market Report: 2024 Edition https://www.energy.gov/eere/wind/land-based-wind-market-report
- Lopez, A., et al. (2022) Offshore Wind Energy Technical Potential for the Contiguous United States (NREL) https://www.nrel.gov/docs/fy22osti/83650.pdf
- U.S. Department of Energy (DOE) (2024) Offshore Wind Market Report 2024 Edition https://www.energy.gov/eere/wind/offshore-wind-market-report
- NREL (2014) Implications of a PTC Extension on U.S. Wind Deployment. https://www.nrel.gov/docs/fy14osti/61663.pdf
- U.S. Environmental Protection Agency (EPA) (2024) Greenhouse Gases Equivalencies Calculator - Calculations and References. https://www.epa.gov/energy/greenhouse-gases-equivalencies-calculator-calculations-and-references#wind
- U.S. Department of Energy (DOE) (2015) Wind Vision Report. http://energy.gov/sites/prod/files/2015/03/f20/wv_full_report.pdf
- U.S. DOE (2022) Renewable Energy Resource Assessment Information for the United States https://www.energy.gov/eere/analysis/renewable-energy-resource-assessment-information-united-states
- Solar Energy Industries Association (SEIA) (2025) Solar Data Cheat Sheet Q2 https://seia.org/research-resources/us-solar-market-insight
- Solar Energy Industries Association (SEIA) (2025) "Solar Industry Research Data" https://www.seia.org/solar-industry-research-data
- NREL (2017) SunShot 2030 for Photovoltaics (PV): Envisioning a Low-cost PV Future. https://www.nrel.gov/docs/fy17osti/68105.pdf
- DOE (2020) Biomass Basics: The Facts about Bioenergy https://www.energy.gov/eere/bioenergy/articles/biomass-basics-facts-about-bioenergy
- "Keoleian, G. and T. Volk (2005) Renewable Energy from Willow Biomass Crops: Life Cycle
Energy, Environmental and Economic Performance" https://css.umich.edu/publications/research-publications/renewable-energy-willow-biomass-crops-life-cycle-energy - U.S. EIA (2025) Annual Energy Outlook 2025 https://www.eia.gov/outlooks/aeo/tables_ref.php
- U.S. DOE, EERE (2020) “Geothermal FAQs.” https://www.energy.gov/eere/geothermal/geothermal-faqs
- IEA (2022) Geothermal 2021 USA Report https://drive.google.com/file/d/17c3OLDOZBfu6PzYDDaHQ_S15jBdiTCRp/view
- DOE (2019) GeoVision: Harnessing the Heat Beneath Our Feet https://www.energy.gov/eere/geothermal/articles/geovision-full-report-0
- IEA (2024) Geothermal 2022 USA Report https://drive.google.com/file/d/1rQv7U1RIy5M4Gc6C5C0MQRBoPJmP7_n6/view
- Arntzen, E., et al. (2013) Evaluating greenhouse gas emissions from hydropower complexes on large rivers in Eastern Washington. Pacific Northwest National Laboratory. http://www.pnl.gov/main/publications/external/technical_reports/PNNL-22297.pdf
- Kumar, A. and T. Schei (2011) “Hydropower.” Cambridge University Press. https://www.ipcc.ch/site/assets/uploads/2018/03/Chapter-5-Hydropower-1.pdf
- Barbose, G. (2023) U.S. Renewables Portfolio Standards 2023 Status Update https://emp.lbl.gov/projects/renewables-portfolio/
- DSIRE (2024) Glossary https://www.dsireusa.org/support/glossary/
- DSIRE (2025) USA Policies Maps: Net Metering. https://ncsolarcen-prod.s3.amazonaws.com/wp-content/uploads/2025/04/DSIRE_Net_Metering_April2025.pdf
- The NC Clean Energy Technology Center (2024) Q1 2024 edition of The 50 States of Solar https://nccleantech.ncsu.edu/wp-content/uploads/2024/04/Q1-24_SolarExecSummary_Final.pdf
- U.S. DOE, EERE (2022) Solar Power in Your Community: A Guide for Local Governments. https://www.energy.gov/eere/solar/local-government-guide-solar-deployment
- DSIRE (2025) Programs https://programs.dsireusa.org/system/program
- DSIRE (2018) “USDA - Rural Energy for America Program (REAP) Grants.” https://programs.dsireusa.org/system/program/detail/917
- U.S. DOE, EERE (2021) "Property Assessed Clean Energy Programs." https://www.energy.gov/eere/slsc/property-assessed-clean-energy-programs
- EPA (2024) Green Banks https://www.epa.gov/statelocalenergy/green-banks
- Solar Energy Industries Association (SEIA) (2024) "Solar Industry Research Data" https://www.seia.org/solar-industry-research-data
- Solar Energy Industries Association (SEIA) (2025) Solar Market Insight Report https://seia.org/research-resources/us-solar-market-insight
- U.S. EIA (2025) State Energy Data System 2023 Consumption https://www.eia.gov/state/seds/seds-data-complete.php?sid=US#Keystatisticsrankings