Social Development Indicators Factsheet
Social development indicators serve as proxies for measuring standards of living. Per capita Gross Domestic Product (GDP) measures the total value of goods and services produced in a region, averaged per person. The Human Development Index (HDI) combines life expectancy, education, and Gross National Income (GNI). The top HDI-ranked countries are Iceland, Norway, and Switzerland.1 Many of the indicators below track progress toward the Sustainable Development Goals (SDGs), set by United Nations members to advance global development.
Population
- In 2024, the U.S. population was 340M.2 World population was 8.2B and is projected to peak at 10.3B by 2080.5
- Sub-Saharan Africa is projected to become the world’s most populated region by 2100, with over 3.3B people by 2100.4
- An estimated 6.7B people will be living in urban areas by 2050, a 68% increase from 2015.3
World Population, Urban and Rural, 1950 to 20503
- Population growth or decline is driven by fertility, mortality, and international migration. Age distribution—shaped by past trends in these factors—also plays a key role.5
- Global fertility rate is projected to decline from 2.25 births per woman in 2024 to 2.1 by the late 2040s.5 Chad and Somalia have the highest fertility rate at 6.1; in the U.S. it is 1.6.5
- In 2024, 4.7M babies were born to girls under 18—340,000 to girls under 15, threatening maternal and child health.5
- In 2023, 4.8M children died before age 5, and 95% of these occurred in 126 countries with growing populations. In Niger, Nigeria, Somalia and Chad, 1 in 10 children die before age 5.5
- Average life expectancy in Least Developed Countries (LDCs) is 67 years, compared to 78 in the U.S.7
- Gender equality and access to family planning stabilize population growth.5 Globally, 16% of women of reproductive age have an unmet demand for contraception.8
- Immigration is expected to slow population decline in low fertility and aging populations, including Australia, Canada, Qatar, and the U.S.5
Income and Inequality
- In 2022, 22% of the world lived in countries with high income inequality—nearly unchanged from 2013. 70% lived in countries with moderate inequality.6
- Slovakia, Slovenia, Belarus, and the Netherlands have the most equal income distributions in the world. There are over 100 countries with more income equality than the U.S.1
- In 2020, extreme poverty rose for the first time in 20 years, driven by the COVID-19 pandemic and Russia’s invasion of Ukraine.10 By 2024, 9% of the world (692M people) lived in extreme poverty. Sub-Saharan Africa made up 16% of the global population but 67% of those living in extreme poverty.6
- In 2023, 11% of the U.S. population lived in poverty. Rates were higher in Black (18%), Hispanic (17%), and Native American (21%) populations.11
- Over 771,000 people in the U.S. experienced homelessness in 2024, the highest on record since reporting began in 2007.12
Food (See U.S. Food System Factsheet)
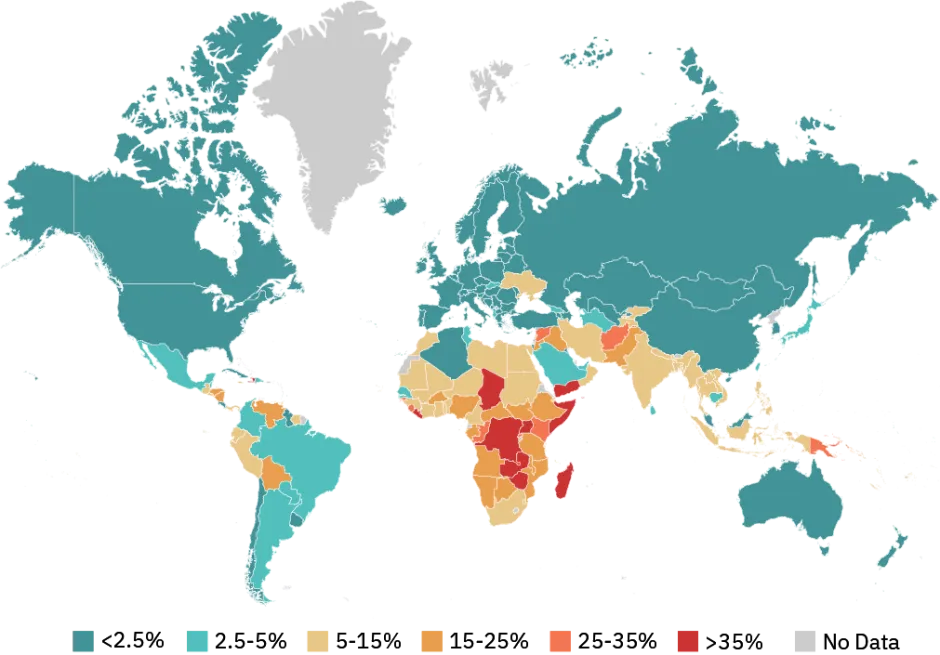
- Globally, 10% of the population faces hunger, and 2.4B people experience moderate to severe food insecurity.9 50% of deaths of children under 5 are linked to malnutrition.15
- In 2022, the share of countries facing high food prices reached a record-high of 58%.9
- On average, food expenditure accounts for 14% of income in developed countries and 30% in developing countries.13,14 The U.S. average is 7% while Nigeria’s is 59%.13
- The Green Revolution of the 20th century boosted agricultural yields and helped feed a rapidly growing global population. Sub-Saharan Africa was the only developing region where increased food production came primarily from expanding crop area, not higher yields.17
Prevalence of Undernourishment, 202316
Water and Sanitation (See Factsheets Related to Water)
- In 2022, 1.5B people lacked access to basic sanitation services, down from 2.7B in 2000. Over half of these people live in Sub-Saharan Africa.18
- Globally, 75% of urban and 65% of rural areas have access to basic hygiene (soap and water). In LDCs, access is lower—43% in urban areas and 29% in rural areas.18
- In 2022, 73% of people had access to safe drinking water at home, 292M had to travel over 30 minutes for drinking water.18 In low-income countries, access was below 30%.18
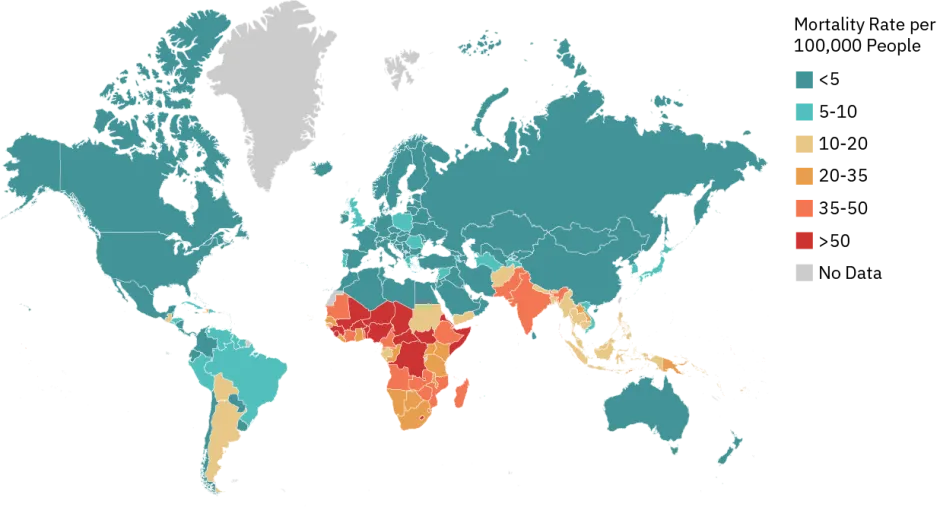
- In 2019, 1.4M deaths were linked to unsafe water and sanitation services. Most were due to diarrhea (74%) and acute respiratory infections (26%).20
Mortality from Unsafe Water and Sanitation, 201920
Healthcare and Disease
- In low-income countries, communicable diseases like malaria remain leading causes of death. In high-income countries, heart and respiratory diseases are the main causes of death.24
- In 2023, there were 263M cases of malaria worldwide, resulting in 597,000 deaths. 95% of these occurred in Africa.21
- In children under 5, 73% of malaria cases are fatal. Progress in reducing malaria mortality has stalled—mortality rates fell only 1.2 points between 2015 and 2023. More populations will be at risk of malaria due to climate change.21,22
- WHO estimates 337M years of life were lost to COVID-19 by 202118 and at least 7M deaths globally as of June 2025.23
- In 2023, 40M people were living with HIV,20 21M were in Eastern and Southern Africa and 630,000 died from AIDS.25 1.3M new infections occurred—38% less than 2010, but far from the SDG target.20
- Household air pollution, mainly smoke from cooking, causes 3.2M deaths each year. Exposure increases the risk of stroke, heart disease, respiratory infections, and lung cancer.26
- Cardiovascular diseases are the leading cause of death globally, causing 35% of all deaths.19
- In 2019, 344M people were pushed into extreme poverty due to out-of-pocket health care costs.20
Health Assistance to Developing Nations28
Education and Employment
- Youth literacy rose from 88% in 2003 (91% and 85% for boys and girls, respectively) to 93% in 2023 (94% and 92%).29
- In 2022, the U.S. spent 5% of GDP on education, compared to the global average of 3.7%.27
- Only 50% of primary schools globally have infrastructure to support students with disabilities. In 2022, 44% of primary, 56% of lower secondary, and 69% of upper secondary schools had internet access—double the rates from 2021.9
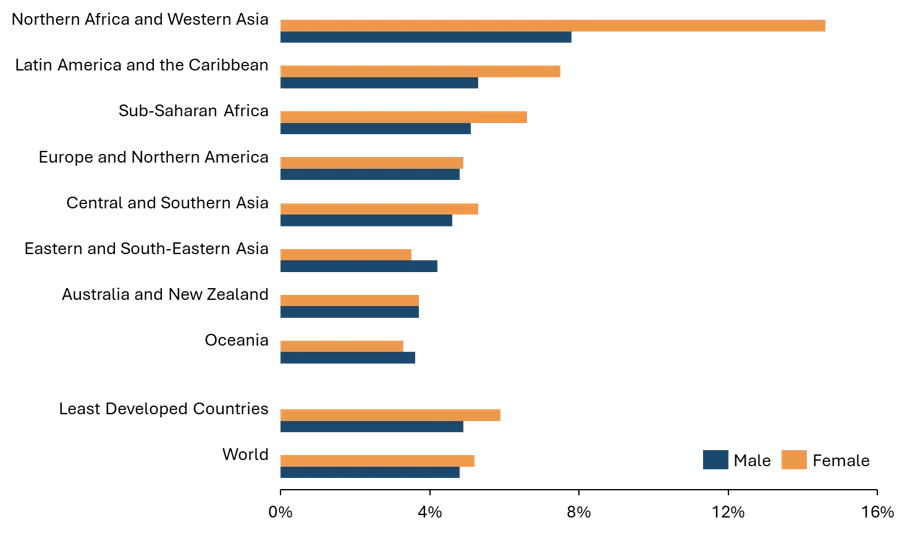
- In 2023, the global unemployment rate fell to 5.1%—below pre-pandemic levels and the lowest since 2000. Global compliance with labor rights declined 7% since 2015. In half of assessed countries, workplace injury rates exceeded 641 per 100,000 workers.9
- In developing countries, 60% of jobs are in agriculture.30
Unemployment by SDG Region, 202332
Environment
- In the 21st century, climate change will increase risks of extinction, flooding, coastal erosion, extreme weather, and health threats from malnutrition and vector-borne diseases. Poor communities are especially vulnerable due to their low adaptive capacity and dependence on local climate.31
- Without climate mitigation, global GDP could fall 7.2% by 2100, compared to 1.1% if Paris Agreement targets are met.33
- 2023 broke climate records and was the warmest year on record. Global temperatures reached 1.45 °C—approaching the 1.5 °C threshold set by the Paris Agreement.9
- In 2022, 74% of the world used clean cooking fuels. 2.1B still relied on fuels like charcoal, coal, and kerosene. Renewable sources made up 19% of final energy consumption in 2021, with the electricity sector as the main contributor. 9
Global Initiatives
- In 2015, the UN adopted 17 SDGs to end poverty and hunger, reduce inequalities, improve health and education, and promote sustainable environments.34
- In 2022, Luxembourg, Sweden, Norway, Germany, Denmark, and the Netherlands reached the UN target of allocating 0.7% of GNI to Official Development Assistance (ODA). The U.S. donates a lower share, but the largest total amount at $61B.35
Center for Sustainable Systems, University of Michigan. 2025. "Social Development Indicators Factsheet." Pub. No. CSS08-15.
References
United Nations (UN) Development Programme (2025) Human Development Report 2025
https://hdr.undp.org/content/human-development-report-2025
U.S. Census Bureau (2025) 2024 National Population Totals and Components of Change: 2020-2024https://www.census.gov/data/tables/time-series/demo/popest/2020s-national-total.html#v2024
UN Population Division (2018) World Urbanization Prospects: 2018 Revision. https://population.un.org/wup/
UN (2022) World Population Prospects 2022 Summary of Results. https://population.un.org/wpp/Publications/
UN Population Division (2024) World Population Prospects 2024 https://population.un.org/wpp/publications?year=2024
World Bank (2024) Poverty, Prosperity, and Planet Report 2024 https://www.worldbank.org/en/publication/poverty-prosperity-and-planet
World Bank (2024) Life Expectancy at Birth https://data.worldbank.org/indicator/sp.dyn.le00.in
UNDESA (2022) World Family Planning 2022 https://www.un.org/development/desa/pd/content/family-planning-0
United Nations (2025) SDG Progress Report 2024-Unedited https://sdgs.un.org/goals
The World Bank (2022) "Poverty and Shared Prosperity 2022: Correcting Course." https://www.worldbank.org/en/publication/poverty-and-shared-prosperity
U.S. Census Bureau (2024) Poverty in the United States 2023 https://www.census.gov/library/publications/2024/demo/p60-283.html
U.S. Department of Housing and Urban Development (2024) The 2024 Annual Homeless Assessment Report (AHAR) to Congress, Part 1: Point-in-time Estimate of Homelessness. https://www.huduser.gov/portal/sites/default/files/pdf/2023-AHAR-Part-1.pdf
USDA Economic Research Service (2023) International Consumer and Food Industry Trends - Expenditures on food in selected countries. https://www.ers.usda.gov/topics/international-markets-us-trade/international-consumer-and-food-industry-trends/data
United Nations (2024) World Economic Situation and Prospects 2024. https://www.un.org/development/desa/dpad/publication/world-economic-situation-and-prospects-2024/
IHME (2024) Global Burden of Disease 2021 https://vizhub.healthdata.org/gbd-compare/
FAOSTAT (2025) Suite of Food Security Indicators https://www.fao.org/faostat/en/#data/FS
Pingali, P. (2012) "Green Revolution: Impacts, Limits, and the Path Ahead." Proceedings of the National Academy of Sciences, 109 (31): 12302-12308. https://www.pnas.org/content/pnas/109/31/12302.full.pdf
UNICEF (2023) Progress on Household Drinking Water, Sanitation, and Hygiene 2000-2022. https://www.unicef.org/wca/reports/progress-household-drinking-water-sanitation-and-hygiene
World Health Organization (WHO) (2023) World Health Statistics 2023. https://www.who.int/publications/i/item/9789240074323
World Health Organization (WHO) (2025) World Health Statistics 2025 https://www.who.int/publications/i/item/9789240110496
WHO (2024) World Malaria Report 2024 https://www.who.int/teams/global-malaria-programme/reports/world-malaria-report-2024
Caminade, C., et al. (2014) "Impact of climate change on global malaria distribution. Proceedings of the National Academy of Sciences." 111(9), 3286–3291. https://www.ncbi.nlm.nih.gov/pmc/articles/PMC3948226/
World Health Organization (WHO) (2025) COVID-19 dashboard https://data.who.int/dashboards/covid19/cases
WHO (2024) The Top 10 Causes of Death https://www.who.int/news-room/fact-sheets/detail/the-top-10-causes-of-death
UNAIDS (2024) Fact Sheet 2024 Global HIV statistics https://www.unaids.org/sites/default/files/media_asset/2024-unaids-global-aids-update-eastern-southern-africa_en.pdf
WHO (2024) "Household Air Pollution." https://www.who.int/news-room/fact-sheets/detail/household-air-pollution-and-health
The World Bank (2024) Government Expenditure on Education. https://data.worldbank.org/indicator/SE.XPD.TOTL.GD.ZS
IHME (2024) Financing Global Health 2023 https://www.healthdata.org/research-analysis/library/financing-global-health-2023-future-health-financing-post-pandemic-era
UIS (2024) Education: Youth Literacy Rate. https://databrowser.uis.unesco.org/browser/EDUCATION/UIS-SDG4Monitoring/t4.6
UNCTAD (2018) Statistical Tables on the Least Developed Countries - 2018. https://unctad.org/en/PublicationsLibrary/ldcr2018stats_en.pdf
World Meteorological Organization (2021) State of the Global Climate 2020. https://public.wmo.int/en/our-mandate/climate/wmo-statement-state-of-global-climate
United Nations (2024) SDG Progress Report 2024 https://unstats.un.org/sdgs/report/2024/
National Bureau of Economic Research (2019) Long-term Macroeconomic Effects of Climate Change: A Cross-Country Analysis. https://www.nber.org/papers/w26167.pdf
UN (2020) Sustainable Development Goals. https://sustainabledevelopment.un.org/?menu=1300
- Organization for Economic Co-operation and Development (2022) Official Development Assistance 2022 – Preliminary Data. https://www.oecd.org/en/data/indicators/net-oda.html