U.S. Environmental Footprint Factsheet
The U.S. population is projected to grow from 335M in 2023 to 364M by 2060.1,2 One way to measure U.S. environmental impact is by estimating how many Earths would be needed if everyone lived like the average American; it would take five Earths to sustain that level of consumption globally.2 Without major shifts in consumption, growing pressure on finite natural resources will accelerate environmental degradation. See other CSS Factsheets that expand on the topics below.
Food
- From 1970 to 2010, average daily calorie consumption in the U.S. rose from 2,054 to 2,501.3 Per capita fat consumption increased by 66%3 while milk consumption decreased 51% to 10.6 gal/yr.4
- Americans consume about 360 calories of added sugars and sweeteners per day.3 The American Heart Association recommends no more than 100–150 calories of added sugars daily for an average adult.5
- In 2023, the average American consumed 43 gal of soft drinks, a 300% increase since 1947.6
- Diets in the top 20% for carbon footprint emit 8 times the GHG of those in the bottom 20%.7
- 41% of U.S. adults and over 20% of adolescents (ages 12–19) are obese (BMI > 30).8
- 30-40% of food in the U.S. is wasted—making it the most commonly landfilled and incinerated material.9 The average American wastes 50% more food than in 1970.10
- Food waste accounts for 22% of municipal solid waste11 and costs of $450 per person annually.10 See U.S. Food Systems factsheet.
Water
- In 2015, U.S. water withdrawals totaled 322B gal/day, down 9% from 2010.12 The largest uses were thermoelectric power (41%), irrigation (37%), and public supply (12%).12
North American Household Water Use13
- Western states used 48% more water per person than eastern states in 2015—primarily due to crop irrigation. Over 50% of water withdrawals occur in just 12 states, California alone accounts for 9%.12
- The average North American household uses 240 gal of water daily for indoor and outdoor uses. With efficient fixtures and no leaks, usage can drop to 40 gal/day per person.13 See U.S. Food Systems factsheet.
Material Use and Waste Management
- In 2000 per capita material use in the U.S. was 23.7 t—52% more than the EU average.14
Average American Lifetime Material Consumption20
Image
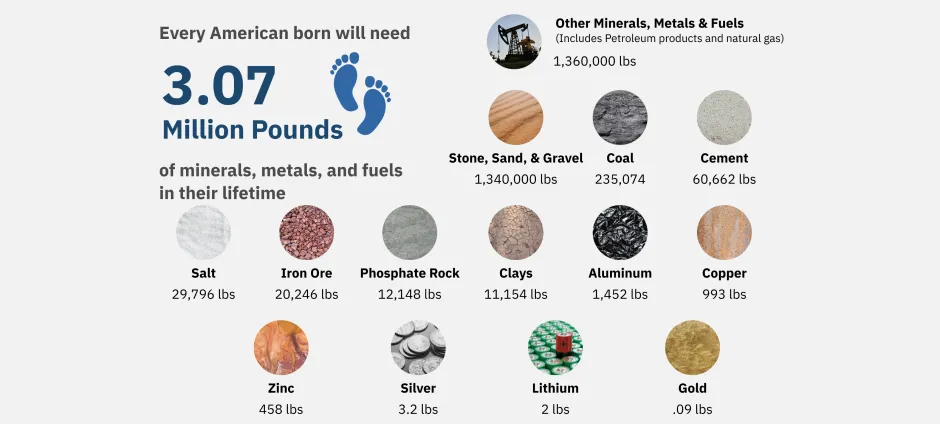
- In 1900, U.S. material use was under 2 t/person. It peaked in 2006 at over 13 t/person.15,16 See U.S. Material Use Factsheet.
- In 2018, the average American generated 4.9 lbs of municipal solid waste (MSW) daily, only 1.6 lbs were recycled or composted.11 MSW daily generation was 2.4 lbs/person in Sweden, 3.6 in Germany, and 2.6 in the U.K.17
- In 2018, 32.1% of U.S. MSW was recycled or composted, diverting 94 Mt from landfills—twice as much as in 1990.11 See U.S. MSW Factsheet.
- Only 53% of Americans are automatically enrolled in curbside recycling programs.18 In 2016, 82% of cities with curbside recycling used single-stream collection, where materials such as glass and paper are separated are sorted at the facility.19
Greenhouse Gases (GHG)
- In 2023, U.S. GHG emissions were 17.6 t CO₂e/person.40 Electricity generation accounts for 25% of the U.S. total.21
- From 1990–2019, emissions increased by 0.8%. In 2020, they fell by 9% due to the COVID-19 pandemic, then rose 6% in 2021—but remained below 1990 levels.21
- In 2023, the Intergovernmental Panel on Climate Change (IPCC) concluded that human activities—principally through GHG emissions—have unequivocally caused global warming, with global surface temperatures reaching 1.1 °C above pre-industrial levels in 2011 to 2020.22
- Individuals can immediately reduce personal GHG emissions by using energy-efficient products and low-emission transportation.
U.S. GHG Emissions by Sector, 2022 (Mt CO2e)21
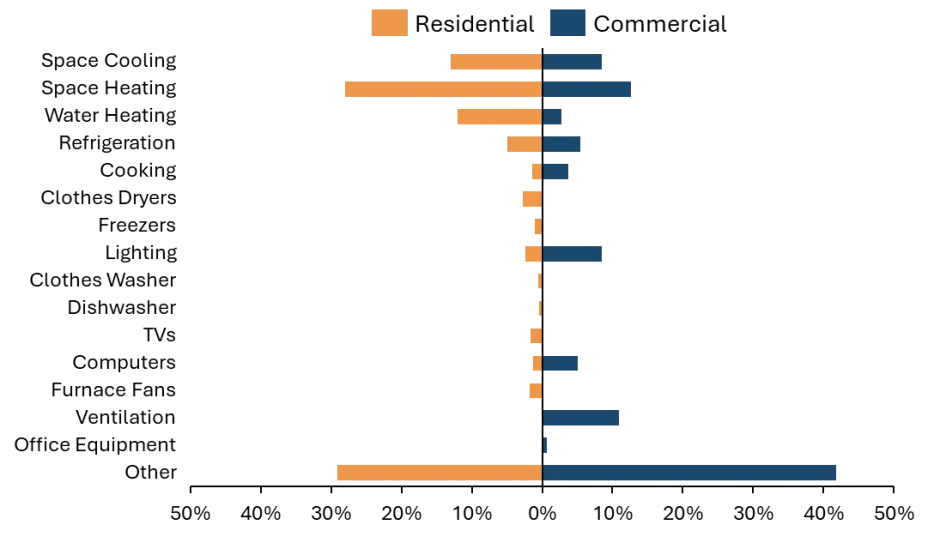
Residential and Commercial Buildings
- From the 1970s to the 2010s, U.S. houses became larger with fewer occupants; House size increased 21.4%23 while occupants per house decreased 14%.24 Living space per person rose 41%.23,24 See Residential Buildings Factsheet.
- Significant energy savings are possible by improving insulation, upgrading to efficient appliances, and using better lighting in both residential and commercial buildings.
- Average site energy intensity in commercial buildings fell by 19%, from 115,000 BTU/ft² in 197925 to 96,500 BTU/ft² in 2022.25 See Commercial Buildings Factsheet.
- Developed land in the U.S. increased by 61% from 1982 to 2017, covering 6% of U.S. land area by 2017.27
Buildings Primary Energy Use, 202426
Image
Transportation
- In 2023, there were 284.6M vehicles in the U.S. and 237.7M licensed drivers.28
- Drivers traveled over 3.2T vehicle-miles—more than double the amount traveled in 1980.28 This is equivalent to 6.5M round-trips to the moon.29
- Compared to 1990 models, the average 2024 vehicle has 29% more weight, 98% more horsepower, and 36% faster acceleration (0–60 mph time).30
- In 2009, fuel economy surpassed 1988 levels after years of decline.31
- Average vehicle occupancy is 1.5 people for a passenger car, 7.5 for a transit bus and 26.1 for a train.32
- In 2022, congestion caused an additional 8.5B hours of travel time, 3.3B gallons of fuel use, and 64.7B lbs of CO₂ emissions in the U.S.33
U.S. Modes of Transportation to Work, 202032
Energy
- In 2022, the U.S. spent $1.7T on energy—about $5,519 per person, or 6.68% of GDP.34
- More U.S. energy comes from petroleum than any other source, comprising nearly 38% of consumption.35
- Daily U.S. per capita energy use included 2.55 gal of oil, 7 lbs of coal, and 267 ft3 of natural gas.35,39
- Residential electricity use was 12 kWh/person daily.35
- In 2022, with less than 5% of the world’s population,36,39 the U.S. consumed 16% of the world’s energy37 and generated 15% of world GDP.38
- The EU had 6% of the world’s population,39 used 10% of global energy, and accounted for 15% of world GDP.38 While China had 18% of the world’s population,36 used 29% of its energy,37 and contributed 18% of world GDP.38
Cite As
Center for Sustainable Systems, University of Michigan. 2025. "U.S. Environmental Footprint Factsheet." Pub. No. CSS08-08.
References
- U.S. Census Bureau (2023) 2023 National Population Projections Tables: Main Series https://www.census.gov/data/tables/2023/demo/popproj/2023-summary-tables.html
- Global Footprint Network (2023) Public Data Package. https://www.footprintnetwork.org/licenses/public-data-package-free/
- U.S. Department of Agriculture (USDA), Economic Research Service (ERS) (2019) Loss-Adjusted Food Availability, Calories. https://www.ers.usda.gov/data-products/food-availability-per-capita-data-system/
- USDA, ERS (2022) Loss-Adjusted Food Availability, Dairy. https://www.ers.usda.gov/data-products/food-availability-per-capita-data-system/
- American Heart Association (2018) “Sugar 101.” https://www.heart.org/en/healthy-living/healthy-eating/eat-smart/sugar/added-sugars
- STATISTA (2024) Soft Drinks Market Data https://www.statista.com/outlook/cmo/non-alcoholic-drinks/soft-drinks/united-states?currency=USD#volume
- Heller, et al. (2018) Greenhouse gas emissions and energy use associated with production of individual self-selected US diets. https://iopscience.iop.org/article/10.1088/1748-9326/aab0ac
- U.S. Department of Health and Human Services (2021) “Health, United States, 2019.” https://www.cdc.gov/nchs/hus/report/previous.htm
- U.S. Environmental Protection Agency (EPA) (2022) "United States 2030 Food Loss and Waste Reduction Goal." https://www.epa.gov/sustainable-management-food/united-states-2030-food-loss-and-waste-reduction-goal
- Natural Resource Defense Council (2017) "Wasted: How America Is Losing Up to 40 Percent of Its Food from Farm to Fork to Landfill." https://www.nrdc.org/sites/default/files/wasted-2017-report.pdf
- U.S. EPA (2020) Advancing Sustainable Materials Management: 2018 Fact Sheet https://www.epa.gov/facts-and-figures-about-materials-waste-and-recycling/advancing-sustainable-materials-management
- Dieter, C., et al. (2018) "Estimated use of water in the United States in 2015." U.S. Geological Survey Circular 1441. https://pubs.usgs.gov/circ/1441/circ1441.pdf
- Water Research Foundation (2016) Residential End Uses of Water, Version 2 Executive Report. https://www.waterrf.org/system/files/resource/2019-07/4309A_1.pdf
- World Resources Institute (2008) Material Flows in the United States: A Physical Accounting of the U.S. Industrial Economy. http://pdf.wri.org/material_flows_in_the_united_states.pdf
- U.S. Geological Survey (2022) Materials Flow in the United States from 1900-2020. https://pubs.er.usgs.gov/publication/fs20173062
- U.S. Census Bureau (2000) Historical National Population Estimates: July 1,1900 to July 1, 1999. https://www2.census.gov/programs-surveys/popest/tables/1900-1980/national/totals/popclockest.txt"
- Organization for Economic Cooperation and Development (OECD) (2024) Municipal Waste Indicator. https://data.oecd.org/waste/municipal-waste.htm
- The Recycling Partnership (2020) 2020 State of Curbside Recycling Report. https://recyclingpartnership.org/wp-content/uploads/dlm_uploads/2020/02/2020-State-of-Curbside-Recycling.pdf
- U.S. EPA (2017) The 2016 State of Curbside Report. https://therecyclingpartnership.app.box.com/s/i0wvano7hi3dr3ivqxv689y4zzo583l2
- Mineral Education Coalition (2023) “Mineral Baby.” https://mineralseducationcoalition.org/mining-minerals-information/mining-mineral-statistics/
- U.S. EPA (2024) Inventory of U.S. Greenhouse Gas Emissions and Sinks: 1990 - 2022. https://www.epa.gov/ghgemissions/inventory-us-greenhouse-gas-emissions-and-sinks-1990-2022
- Intergovernmental Panel on Climate Change (IPCC) (2023) Synthesis Report of the IPCC Sixth Assessment Report (AR6) Longer Report. https://www.ipcc.ch/report/ar6/syr/
- U.S. Energy Information Administration (EIA) (2023) Residential Energy Consumption Survey, 2020. https://www.eia.gov/consumption/residential/data/2020/#squarefootage
- U.S. Census Bureau (2022) Historical Household Tables. https://www.census.gov/data/tables/time-series/demo/families/households.html
- U.S. EIA (2012) Annual Energy Review 2011. http://www.eia.gov/totalenergy/data/annual/
- U.S. Energy Information Administration (EIA) (2025) Annual Energy Outlook 2025 https://www.eia.gov/outlooks/aeo/
- USDA National Resource Conservation Service (2020) Natural Resources Inventory 2017. https://www.nrcs.usda.gov/wps/portal/nrcs/main/national/technical/nra/nri/results/
- U.S. Department of Transportation (DOT), Federal Highway Administration (FHWA) (2024) Highway Statistics 2023. https://www.fhwa.dot.gov/policyinformation/statistics/2023/
- National Aeronautics and Space Administration (2022) “Earth’s Moon: Our Natural Satellite.” +F78 https://solarsystem.nasa.gov/moons/earths-moon/in-depth/
- U.S. Environmental Protection Agency (EPA) (2024) The 2024 EPA Automotive Trends Report. https://www.epa.gov/automotive-trends/download-automotive-trends-report#Full%20Report
- U.S. EPA (2021) 2021 Automotive Trends Report. https://www.epa.gov/automotive-trends/download-automotive-trends-report#Full%20Report
- U.S. DOE, Oak Ridge National Lab (2022) Transportation Energy Data Book: Edition 40. https://tedb.ornl.gov/
- Texas A&M Transportation Institute (2023) 2023 Urban Mobility Report. https://mobility.tamu.edu/umr/report/
- U.S. EIA (2024) State Energy Data System 2022. https://www.eia.gov/state/seds/seds-data-complete.php?sid=US
- U.S. EIA (2024) Monthly Energy Review July 2024. https://www.eia.gov/totalenergy/data/monthly/
- U.S. Central Intelligence Agency (2022) The World Factbook. https://www.cia.gov/the-world-factbook/countries/
- U.S. EIA (2024) “International Energy Data - Total Energy Consumption." https://www.eia.gov/international/data/world
- U.S. Central Intelligence Agency (2024) The World Factbook. https://www.cia.gov/the-world-factbook/countries/world/#economy
- U.S. Central Intelligence Agency (2023) The World Factbook. https://www.cia.gov/the-world-factbook/countries/
- EDGAR (2023) GHG emissions of all world countries 2023 https://edgar.jrc.ec.europa.eu/report_2023?vis=co2pop#emissions_table