Biofuels Factsheet
Image

Biofuels have the potential to reduce the energy and greenhouse gas emission intensities associated with transportation, but can have other significant effects on society and the environment. Depending on demand, crop growing conditions, and technology, they may require significant increases in cropland area and irrigation water use. Also, biofuels may have already affected world food prices.
Patterns of Use
Production
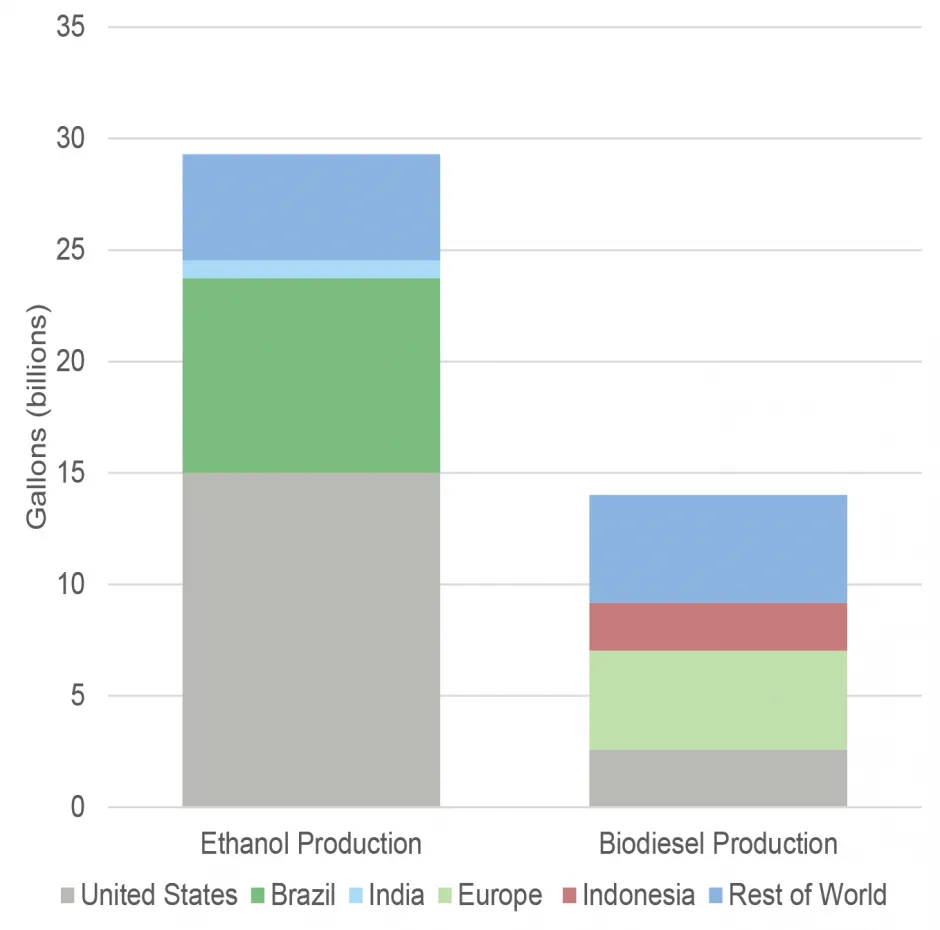
- In the U.S., ethanol is primarily derived by processing and fermenting the starch in corn kernels into a high-purity alcohol. 94% of U.S. ethanol is derived from corn, while Brazil uses sugar cane as the primary feedstock.1,2
- The U.S. and Brazil produced about 81% of the world’s ethanol in 2021.3
- In the 2021/22 season, 5.3 billion bushels of corn, 36% of the U.S. supply, became ethanol feedstock.4
- Cellulosic ethanol feedstocks are abundant and include corn stalks, plant residue, waste wood chips, and switchgrass. Making ethanol from these sources is more difficult because cellulose does not break down into sugars as easily.5
- Biodiesel can be made from animal fats, grease, vegetable oils, and algae. In the U.S., soybean oil, corn oil, and recycled cooking oils are common feedstocks.6
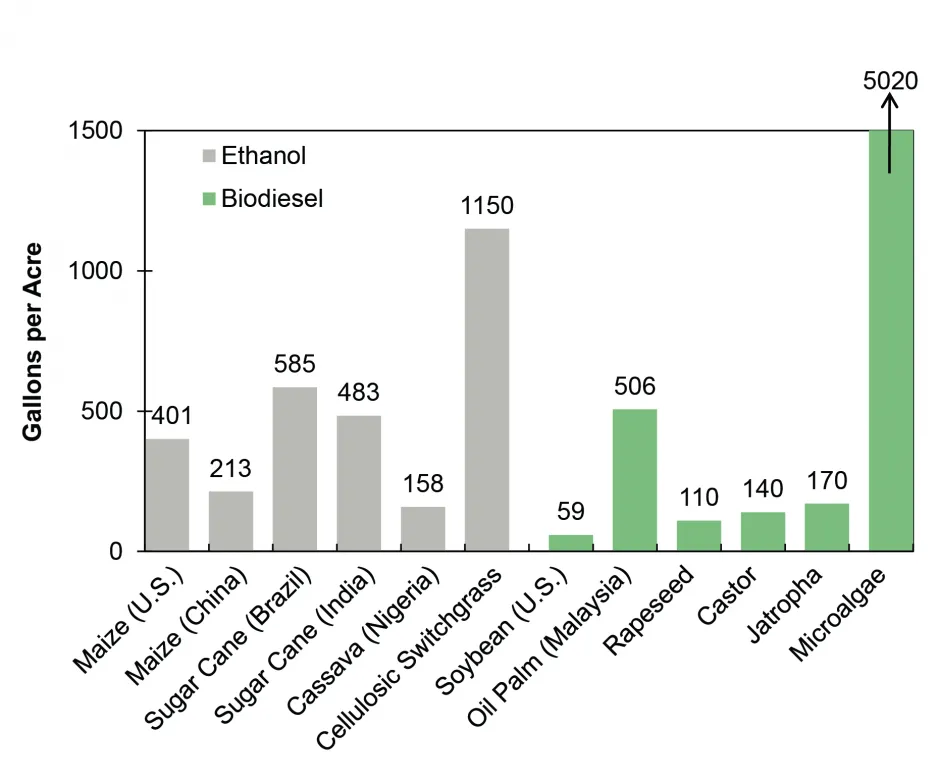
- Biodiesel from algae is an area of ongoing research. Algae could potentially produce 10 to 100 times more fuel per acre than other crops.7
World Fuel Ethanol Production, 20213 (Billion gallons)
Image
Biofuel Yields by Feedstock8,9,10,11
Image
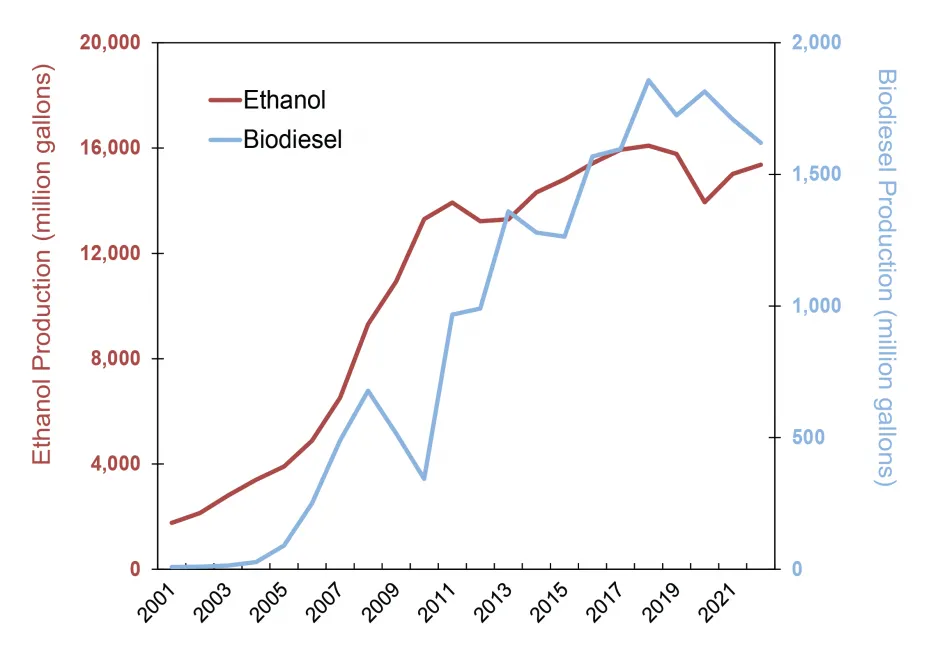
U.S. Biofuel Production, 2001-202212
Image
Consumption and Demand
- In 2022, for the third time since tracking began, the U.S. exported more oil than it imported. The average U.S. petroleum consumption was 20.28 million barrels per day.12 In 2022, there were 192 ethanol refineries and 72 biodiesel production plants in the U.S.13,14
- U.S. biodiesel production facilities operated at 72% capacity in 2022.12,14
- Many biodiesel producers are reliant on federal tax credits and remain sensitive to feedstock (soybean oil) and energy (petroleum) prices. The Inflaction Reduction Act (IRA) reinstated and extended several biofuel tax incentives through 2024.15,16
- In 2022, 10% of U.S. vehicle fuel consumption (by volume) was ethanol and over 98% of U.S. gasoline contains ethanol.2,12
- E85 sells for less than regular gasoline, but contains less energy per gallon. Flex-fuel vehicles using E85 see a 15-27% reduction in fuel economy.17
- By 2024 the global demand for biofuels is expected to increase by 11%.16
Life Cycle Impacts
Energy
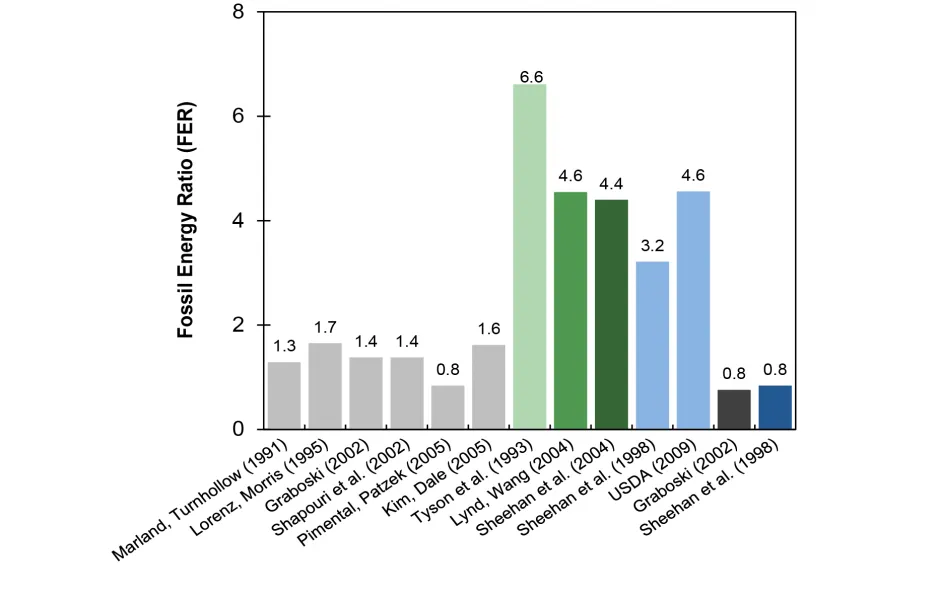
- The Fossil Energy Ratio (FER) is the ratio of energy output to nonrenewable energy inputs.18 Gasoline has a value of 0.8 (1.2 BTU of fossil fuel needed to supply 1 BTU of gas at the pump).20 Recent estimates of ethanol’s FER is around 1.5, though areas with highly efficient corn agriculture, such as Iowa and Minnesota, have FERs close to 4, and scientists believe with increased efficiency in biomass handling, the FER could eventually rise to 60.21
- From 1990-2006, the FER for soybean biodiesel improved from around 3.2 to 5.5.22 During the same period, ethanol transitioned from an energy sink to a net energy gain. Much of the improvement came from the reduction of fertilizer inputs to grow corn.21
- In comparison, petroleum-based diesel has a FER of 0.83.23
Fuel Return on Fossil Energy Investment18,19
Image
Greenhouse Gases (GHGs) (See Greenhouse Gases Factsheet)
- Globally, biofuels replaced the consumption of 2 million barrels of oil equivalent per day in 2022, or 4% of the global transport sector oil demand.16
- On average, GHG emissions from corn ethanol are 34% lower than gasoline when including Land Use Change (LUC) emissions and 44% lower when excluding them.24
- GHG emissions for cellulosic ethanol average around 97% lower than gasoline when including LUC emissions and 93% lower when excluding LUC emissions.24
- The use of B20 (20% biodiesel, 80% petroleum diesel), a common biodiesel blend in the U.S., can reduce CO₂ emissions by 15% compared to petroleum diesel. The use of B100 (100% biodiesel) can reduce CO₂ emissions by 74%.25,26
- Biodiesel CO₂ emissions are assumed to be taken up again by growth of new feedstock, thus, tailpipe CO₂ emissions from biofuels are excluded from emissions calculations.27,28
- Studies have suggested that increased biofuel production in the U.S. will increase global GHG emissions, due to higher crop prices motivating farmers in other countries to convert non-cropland to cropland. Clearing new cropland releases carbon stored in vegetation, preventing the future storage of carbon in those plants.29
Other Impacts
- A large hypoxic zone occurs in the Gulf of Mexico each summer, with a five-year average area of 4,280 square miles.30 Excess nitrogen, primarily from fertilizer runoff from Midwestern farms, causes algae blooms that decompose and deplete dissolved oxygen, injuring or killing aquatic life. Increasing corn ethanol acreage without changing cultivation techniques will make reducing the hypoxic zone more difficult.31
- Globally, average arable land used for biofuels is predicted to rise from 2.5% today to 6% in 2050. However, the impacts of growing biofuel crops vary widely due to regional differences in climate and farmland availability.32
- The irrigation of feedstocks requires considerably more water than the manufacturing of biofuels. Although a typical biorefinery consumes 1 to 4 gallons of water per gallon of biofuel, corn grown in 2003 in Nebraska’s dry climate required 780 gallons of irrigation water per gallon of ethanol.34 The majority of corn production for ethanol relies on substantial irrigation from groundwater.35
- A review of studies focused on the food price crisis of 2006-2008 found that the growth of biofuel feedstock contributes 20-50% to the price increase of maize. Land use change resulting from the expected increase in biofuel demand is expected to increase global maize and wheat prices 1-2% and vegetable oil prices by around 10%.36
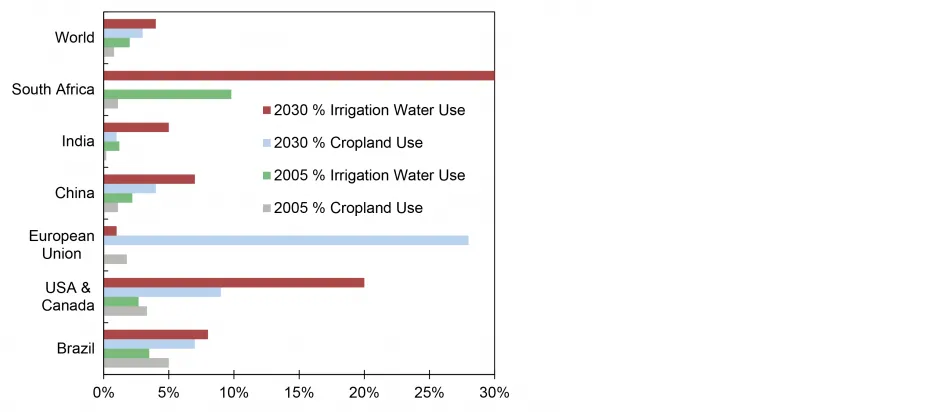
Percentage of Cropland and Irrigation Water Required for Biofuels, 2005 vs 203033
Image
Solutions and Sustainable Actions
- Under the Energy Independence and Security Act of 2007, the Renewable Fuel Standard (RFS2) required that 36 billion gallons per year (bg/y) of biofuels be produced by 2022: 16 bg/y from cellulosic sources, 5 bg/y from other advanced sources, and no more than 15 bg/y of corn ethanol. Life cycle GHG standards are also in place to ensure the biofuels produce fewer emissions than their petroleum counterparts.37
- U.S. ethanol producers, blenders, and resellers have been supported by tax incentives, some of which were extended in 2022 by the IRA.15
- Fuel content standards are one policy option to encourage biofuel use. Regular gasoline sold in Brazil is required to contain 27% ethanol.38
- In 2012, new auto manufacturing standards for model years 2017-2025 were set, raising corporate average fuel economy (CAFE) standards to 54.5 miles per gallon for new light-duty vehicles in 2025. In 2020, the Safer Affordable Fuel-Efficient (SAFE) Vehicle Rule weakened the CAFE standards.39,40 In 2022, the Biden administration directed the NHTSA to revise the SAFE Rule, which set fuel economy standards for passenger cars and light trucks to approximately 49 mpg by 2026.41
- Public transportation, carpooling, biking, and telecommuting are excellent ways to reduce transportation energy use and related impacts. See the CSS Personal Transportation Factsheet for more information. See the CSS Personal Transportation Factsheet for more information.
Cite As
Center for Sustainable Systems, University of Michigan. 2023. "Biofuels Factsheet." Pub. No. CSS08-09.
References
- U.S. Energy Information Administration (EIA) (2022) “Biofuels Explained: Ethanol.”
- U.S. Department of Energy (DOE), Energy Efficiency and Renewable Energy (EERE) (2020) “Ethanol Fuel Basics.”
- International Energy Agency (IEA) (2021) “Renewable Energy Market Update 2021.”
- U.S. Department of Agriculture (USDA), Economic Research Service (ERS) (2023) U.S. Bioenergy Statistics.
- U.S. DOE, EERE (2020) “Ethanol Feedstocks.”
- U.S. EIA (2022) “Biofuels Explained: Biomass-based diesel fuels, Biodiesel.”
- U.S. DOE, Pacific Northwest National Lab (2021) “Algal Biofuels - Investigating growth and productivity of algae for biofuels”
- Chisti, Y. (2007) “Biodiesel from microalgae.” Biotechnology Advances 25: 294-306.
- United Nations Food and Agriculture Organization (2008) The State of Food and Agriculture.
- Oak Ridge National Laboratory (2005) “Biofuels from Switchgrass: Greener Energy Pastures.”
- Fulton, L. (2006) “Biodiesel: Technology Perspectives.” Geneva UNCTAD Conference.
- U.S. EIA (2023) Monthly Energy Review, May 2023.
- U.S. EIA (2022) U.S. Fuel Ethanol Plant Production Capacity.
- U.S. EIA (2022) U.S. Biodiesel Plant Production Capacity.
- Internal Revenue Service (2022) “Fuel Tax Credits.”
- International Energy Agency (IEA) (2023) “Renewable Energy Market Update: Outlook for 2023 and 2024.”
- U.S. DOE, EERE (2023) Fuel Economy Guide Model Year 2023.
- USDA (2009) Energy Life Cycle Assessment of Soybean Biodiesel.
- Hammerschlag, R. (2006) “Ethanol’s Energy Return on Investment: A Survey of the Literature 1990-Present.” Environmental Science & Technology, 40: 1744-1750.
- U.S. DOE, EERE (2007) Ethanol: The Complete Lifecycle Energy Picture.
- USDA (2015) Energy Balance for the Corn-Ethanol Industry
- Pradhan, A., et al. (2011) “Energy Life-Cycle Assessment of Soybean Biodiesel Revisited.” American Society of Agricultural and Biological Engineers, 54(3): 1031-1039.
- USDA, DOE (1998) Life Cycle Inventory of Biodiesel and Petroleum Diesel for Use in an Urban Bus.
- Wang, M., et al. (2012) “Well-to-wheels energy use and greenhouse gas emissions of ethanol from corn, sugarcane and cellulosic biomass for US use.” Environmental Research Letters, 7: 1-13
- U.S. DOE, EERE (2017) Biodiesel Basics.
- U.S. DOE EERE (2021) “Biodiesel Benefits and Considerations.”
- Pelkmans, L., et al. (2011) “Impact of biofuel blends on the emissions of modern vehicles.” Journal of Automobile Engineering, 225: 1204-1220.
- U.S. EIA (2020) “How much carbon dioxide is produced by burning gasoline and diesel fuel?”
- Searchinger, T., et al. (2008) “Use of U.S. Croplands for Biofuels Increases Greenhouse Gases Through Emissions from Land-Use Change.” Science, 319: 1238-1240.
- NOAA National Center for Coastal Ocean Science (2022) Smaller than Expected Summer 2022 ‘Dead Zone’ Measured in Gulf ofMexico.
- U.S. EPA (2019) “Hypoxia 101.”
- Popp, J., et al. (2014) The Effect of Bioenergy Expansion: Food, Energy, and Environment. Renewable and Sustainable Energy Reviews, 32: 559-578.
- de Fraiture, C., et al. (2008) “Biofuels and Implications for agricultural water use: blue impacts of green energy.” Water Policy, 10: 67-81.
- National Academy of Sciences (2008) Water Implications of Biofuels Production in the United States.
- Schaible, G. and M. Aillery (2012) Water Conservation in Irrigated Agriculture: Trends and Challenges in the Face of Emerging Demand. USDA ERS ERB-99.
- Malins, C. (2017) “Thought for Food: A review of the interaction between biofuel consumption and food markets.”
- U.S. House of Representatives (2007) Resolution 6-310, 110th Congress.
- USDA Foreign Agricultural Services (2015) Biofuels - Brazil Raises Federal Taxes and Blend Mandate.
- National Highway Traffic Safety Administration (NHTSA) and U.S. EPA (2012) “2017 and Later Model Year Light-Duty Vehicle Greenhouse Gas Emissions and Corporate Average Fuel Economy Standards, Final Rule.” Federal Register, 77:199.
- NHTSA and U.S. EPA (2020) “The Safer Affordable Fuel-Efficient (SAFE) Vehicles Rule for Model Years 2021–2026 Passenger Cars and Light Trucks, Final Rule.” Federal Register, 85:84.
- National Highway Traffic Safety Administration (NHTSA) (2022) Corporate Average Fuel Economy Standards for Model Years 2024-2026 Passenger Cars and Light Trucks ; Final Rule. Federal Register, 87:84.