Environmental Justice Factsheet
Image

Environmental Justice (EJ) is defined as the equal treatment and involvement of all people in environmental decision making.1 Inspired by the Civil Rights movement, EJ became widespread in the 1980s at the intersection of environmentalism and social justice.2 Environmental injustice is experienced through heightened exposure to pollution and corresponding health risks, limited access to adequate environmental services, and loss of land and resource rights.3 EJ and sustainability are interdependent and both necessary to create an equitable environment for all.4
Built Environment (See Factsheets Related to the Built Environment)
- The changing demographics of urban areas, loose permitting requirements, and exclusionary zoning laws have funneled racial and ethnic minorities into areas with a greater degree of environmental degradation and reduced support.3
- When urban areas were developing across the U.S., zones reserved exclusively for residential purposes were often expensive. Meanwhile, mixed-use zones were more affordable but allowed residential and industrial buildings to be built side by side. This led to a higher population density in areas closer to environmental hazards.3
- Residents of environmentally degraded areas do not or cannot move because of a lack of financial resources, ownership of current land, and sense of place.3
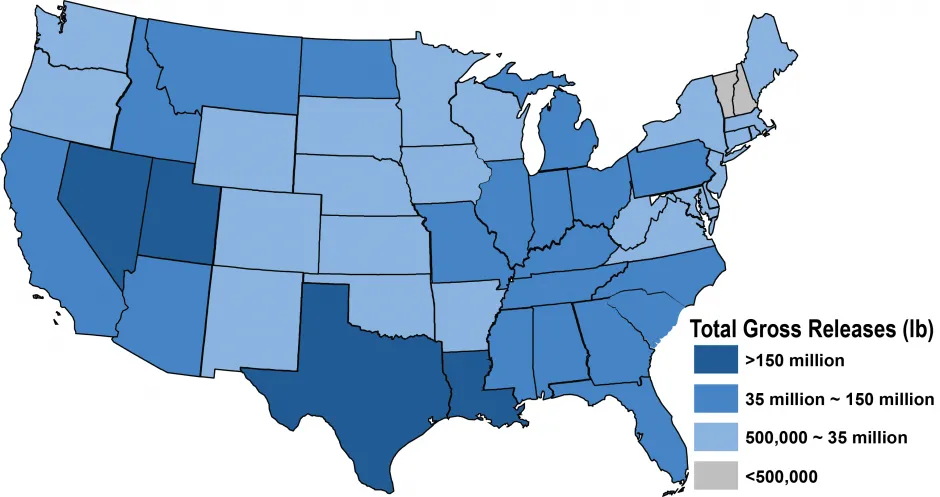
- The Toxic Release Inventory (TRI) was created in 1986 under the Emergency Planning and Community Right-to-Know Act to support emergency planning and publicize information about toxic releases.5
- On average, people of color make up 56% of the population living in neighborhoods with TRI facilities, compared to 30% elsewhere.7
- Negative environmental factors can compound social and economic conditions and lead to higher levels of chronic health problems such as asthma, diabetes, and hypertension for minorities and low-income communities.8 Due to long-standing inequalities in living, working, health, and social conditions, minorities in the U.S. have an increased risk for infection, hospitalization, and death from COVID-19 compared to non-Hispanic white persons.9
- Availability of cheap land in disadvantaged urban centers has led to gentrification, an increase in property values that often makes the area unaffordable to existing (generally lower-income) residents. This leads to displacement as well as social, economic, and cultural stress.3,10
- Green spaces improve the physical, social, and economic well-being of a community by providing places to exercise, socialize, and organize, while supporting stable community development.11
- Due to uneven distribution patterns, minority and low income communities have far less access to green spaces than white, affluent communities and have limited resources to maintain the green spaces they do have.12
Total Toxic Releases by State, 20216
Image
Food (See U.S. Food System Factsheet)
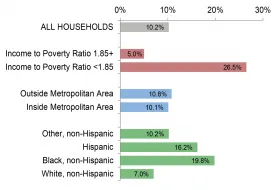
- In 2021, 10.2% of U.S. households experienced food insecurity at some point during the year — reducing their access to adequate food for an active, healthy lifestyle.13
- In 2021, rates of food insecurity for Black and Hispanic households were higher than the national average and higher in rural versus urban areas.13
- Food prices are higher and quality is lower in high poverty areas.14 In 2021, the average U.S. household spent 12% of income on food; low-income families spent over 30%.15
- Hispanic and Black children have higher obesity rates than White and Asian children.16
- About 53.6 million people (17.4% of total U.S. population) have low access to a supermarket due to limited transportation and uneven distribution of supermarkets.17
- A case study in Detroit found that households in poor Black communities were on average 1.1 miles farther from a supermarket than in the poorest White neighborhoods.14
Prevalence of Food Insecurity in United States in 202113
Image
Energy (See Factsheets Related to Energy)
- The presence of power plants and fuel resource extraction operations place a significant environmental burden on neighboring communities. Minority and low-income communities are directly and disproportionately affected by polluting facilities and are rarely included in discussions and decision-making processes regarding such facilities.18
- The average income of residents living within three miles of a coal power plant in 2000 was over $3,000 less than the national average.19
Hydropower and Dams
- Dams threaten vulnerable populations through food insecurity, increased morbidity, and the loss of land and water access, jobs, and homes.20
- Dam construction often displaces low income communities because of financial pressure from wealthier groups or private investors.20
- Environmental concerns associated with hydropower include fish mortality, water quality impairment, alteration of natural landscapes and destruction of sacred Indigenous sites.21
Energy Poverty
- Nearly 37 million American homes suffer from energy poverty, the inability to meet a household’s energy needs.22 This makes them vulnerable to detrimental health effects during periods of intense heat or cold.23
- Energy poverty results from income inequality and inequalities in energy prices, housing, and energy efficiency.23
- Low-income households spend three times as much of their income on energy than non-low-income households, despite consuming less energy.22
- A case study found that energy-efficient light bulbs are less available and more expensive in higher poverty urban areas.24
Materials (See Factsheets Related to Material Resources)
Mining
- Roughly 3% of the country’s oil and natural gas reserves, 15% of coal reserves and between 37-55% of uranium reserves are located on Indigenous land.3
- The U.S. imports more than 90% of the elements critical to advanced energy generation, transmission, and storage.25
- Artisanal and small scale mining (ASM) accounts for 15-20% of global mineral and metal production. ASM often has unsafe working conditions (e.g., child labor) and bad environmental practices (e.g., high mercury emissions).26
Electronic Waste (See Green IT Factsheet)
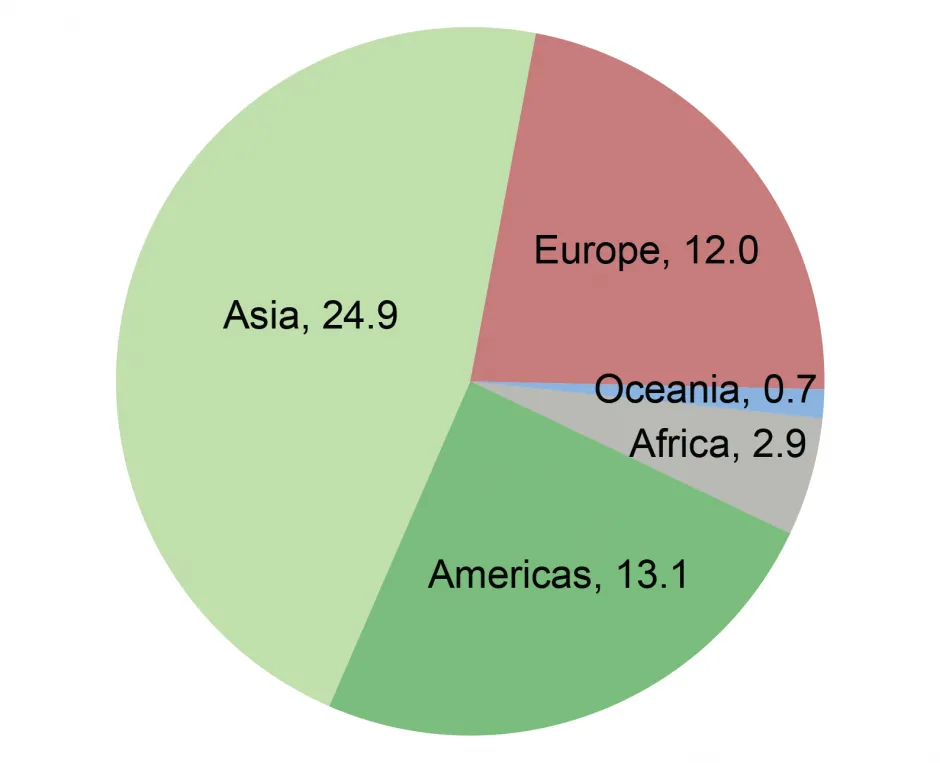
- In 2019, 53.6 metric tons (t) of e-waste were generated, with Asia being the largest contributor.27
- Improper recycling and recovery procedures can lead to exposure to carcinogenic and toxic materials, which often occurs in developing nations where recycling regulations to limit worker exposure are lax or nonexistent.28
- A review conducted by researchers found increased DNA damage in those living in e-waste recycling towns, along with increases in still and premature births.29
- An estimated 6-29% of the 40 million computers retired in the U.S. were exported in 2010.30 The International Trade Commission found that the U.S. exported 7% of its used electronics by value in 2011.31
Global E-Waste Generation (t), 201927
Image
Climate (See Factsheets Related to Climate Change)
- The World Health Organization estimates that climate change will cause an additional 250,000 deaths per year between 2030 and 2050.33
- Though wealthy, developed nations like the U.S. emit larger amounts of GHG per capita, developing nations experience the worst effects of climate change relative to wealthier countries due to their limited resources and ability to adapt.4,32
- Low-income communities are more likely to be exposed to climate change threats (e.g., flooding, storms, and droughts) due to inadequate housing and infrastructure.32 People living closer to the coast and small island nations are more vulnerable to severe storms, sea level rise, and storm surges as a result of climate change.32
- Indigenous populations that rely on subsistence farming practices for food have limited options for adapting to climate change threats.32
- Areas with poor healthcare infrastructure - common in developing nations - will be the least able to cope with catastrophic effects of climate change such as heat waves, droughts, severe storms, and outbreaks of waterborne diseases.33
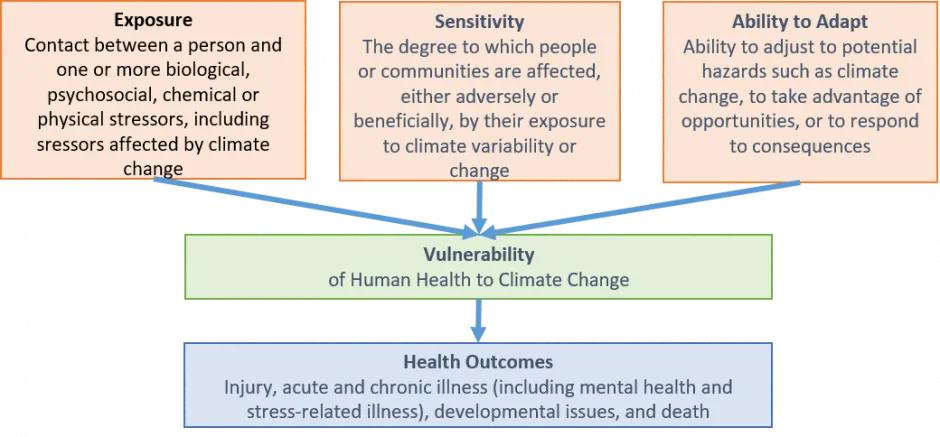
VULNERABILITY TO CLIMATE CHANGE32
Image
Solutions
- Launched in 2015, EJSCREEN makes data on environmental and demographic characteristics in the U.S. accessible to the public. It assists federal agencies by displaying existing environmental injustice impacts on areas open to development.34
- As of 2023, the EPA’s EJ program has granted over $37 million to community projects and organizations in over 1,500 communities focusing on clean air, healthy water, land revitalization, and environmental health.35
- The Justice40 Initiative, established by executive order in 2021, set a national goal that disadvantaged communities will receive 40% of the benefits provided by Federal investments into areas like climate change and clean energy.36
- The Inflation Reduction Act provides resources for disadvantaged and minority communities to reduce pollution, improve clean transit, make clean energy more affordable and accessible, and strengthen resilience to climate change.37
- Use the Environmental Justice Atlas website to learn about and spread awareness on an expanse of EJ issues.38
- Engage in and support bottom-up models of research that are responsive to the environmental concerns of communities rather than the interests of large, corporate funders. Advocate for the inclusion of local knowledge in research in addition to observations obtained from scientific methods.18
Cite As
Center for Sustainable Systems, University of Michigan. 2023. "Environmental Justice Factsheet." Pub. No. CSS17-16.
References
- U.S. Environmental Protection Agency (EPA) (2017) Learn About Environmental Justice.
- U.S. Department Of Energy (DOE) Environmental Justice.
- Taylor, D.E. (2014) “Toxic Communities.” New York University Press.
- Salkin, P., et al. (2012) “Sustainability as a Means of Improving Environmental Justice.” Journal of Sustainability and Environmental Law, 19(1):3-34.
- U.S. EPA (2021) Learn about the Toxics Release Inventory.
- U.S. EPA (2023) “2021 Toxic Release Inventory National Analysis: Where You Live.”
- Bullard, R., et al. (2008) Toxic Wastes and Race at Twenty: Why Race Still Matters After All of These Years. Environmental Law (38)2: 371-411.
- U.S. Center for Disease Control and Prevention (CDC) (2013) CDC Health Disparities and Inequalities Report — United States, 2013.
- U.S. CDC (2021) “Trends in Racial and Ethnic Disparities in COVID-19 Hospitalizations, by Region — United States, March–December 2020.”
- U.S. EPA (2017) Equitable Development and Environmental Justice.
- The Trust for Public Land (2006) The Health Benefits of Parks.
- Wolch, J., et al. (2014) “Urban green space, public health, and environmental justice.” Landscape and Urban Planning, 125:234-244.
- USDA (2022) Household Food Security in the United States in 2021.
- Walker, R., et al. (2009) “Disparities and access to healthy food in the United States.” Health & Place, 16(5):876-884.
- USDA (2023) Ag and Food Statistics Charting the Essentials, February 2023.
- National Institute of Diabetes and Digestive and Kidney Diseases (2021) Overweight & Obesity Statistics.
- USDA (2021) Food Access Research Atlas —Documentation.
- Ottinger, G. (2013) “The Winds of Change: Environmental Justice in Energy Transitions.” Science as Culture, 22(2):222-229.
- National Association for the Advancement of Colored People (2012) “Coal Blooded.”
- VanCleef, A. (2016) “Hydropower Development and Involuntary Displacement: Toward a Global Solution.” Indiana Journal of Global Legal Studies, 23(1):349-376.
- Kumar, A. and T. Schei (2011) “Hydropower.” Cambridge University Press.
- Bednar, D. and Reames, T. (2020) Recognition of and response to energy poverty in the United States. Nature Energy. 5:432-439.
- Reames, T. (2013) “Targeting Energy Justice.” Energy Policy, 97:549-558.
- Reames, T., et al. (2018) “An incandescent truth: Disparities in energy-efficient lighting availability and prices in an urban U.S. county.” Applied Energy 218:95-103.
- American Physical Society Panel on Public Affairs and Materials Research Society (2011) Energy Critical Elements: Securing Materials for Emerging Technologies.
- Maier, R., et al. (2014) “Socially responsible mining.” Reviews of Environmental Health, 29(1-2):83-89.
- United Nations Institute for Training and Research (UNITAR) (2022) Global Transboundary E-waste Flows Monitor 2022.
- U.S. EPA (2012) Rare Earth Elements: A Review of Production, Processing, Recycling, and Associated Environmental Issues.
- Grant, K., et al. (2013). “Health consequences of exposure to e-waste: a systematic review.” The Lancet Global Health, 1(6).
- Kahhat, R. and E. Williams (2012) “Materials flow analysis of e-waste: Domestic flows and exports of used computers from the United States” Resources, Conservation and Recycling, 67:67-74.
- U.S. International Trade Commission (2013) Used Electronic Products An Examination of U.S. Exports.
- U.S. EPA (2017) Understanding the Connections Between Climate Change and Human Health.
- World Health Organization (2016) Climate Change and Health.
- U.S. EPA (2016) “How was EJSCREEN Developed?”
- U.S. EPA (2023) Environmental Justice Small Grants Program.
- The White House (2022) Justice40 A Whole of Government Initiative.
- The White House (2022) Fact Sheet Inflation Reduction Act Advances Environmental Justice
- Environmental Justice Atlas. https://ejatlas.org/