Carbon Footprint Factsheet
A carbon footprint measures the total greenhouse gas (GHG) emissions—direct and indirect—associated with an individual, organization, product, or event1 across all stages of its lifecycle: from material extraction and manufacturing to use and disposal. Common GHGs include carbon dioxide (CO₂), methane (CH₄), and nitrous oxide (N₂O). Because these gases differ in how strongly they trap heat, emissions are expressed in carbon dioxide equivalents (CO₂e), using each gas’s global warming potential (GWP) as a conversion factor (See Greenhouse Gases Factsheet).1 The U.S. per capita carbon footprint (17.6 t CO₂e/yr) in 2023 was more than twice the global average (6.6 t CO₂e/yr).2
Sources of Household Emissions
Household consumption indirectly accounts for over 70% of total U.S. emissions.3,4 An average U.S. household has a carbon footprint of 48 t CO₂e/yr,3 30% of this is from transportation.63 16–20% of household emissions are from overseas production—household goods (China), fuel (Canada), and food (Mexico).4
Average U.S. Household Emissions per year5
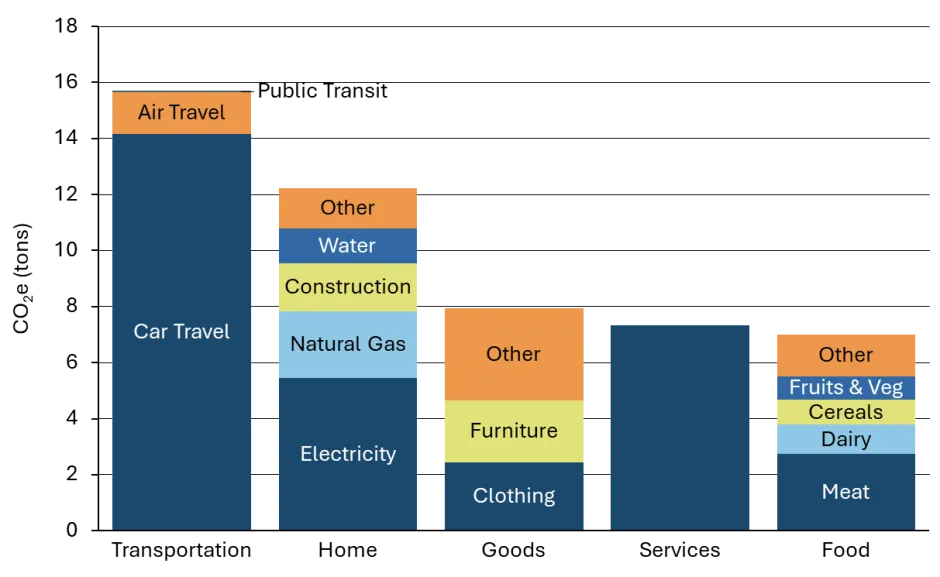
Transportation (Personal Transportation Factsheet)
- The average passenger car emits 0.67 lbs of CO₂e per mile driven.6 Over its lifetime, a gasoline car emits about 66,000 lbs of CO₂e—84% comes from driving.7 In 2022, cars and light trucks generated 16% of total U.S. emissions (1.03 Gt CO₂e).8 See Electric Vehicle Factsheet for GHG emissions from ICEVs and EVs.
- In 2019, annual per capita miles driven reached 9,937.9
- Fuel economy rose 40% from 2005–2023, reaching an average of 28 mpg by 2024.6 Driving at the speed limit boosts fuel economy by 7–14%, every 5 mph over 50 is equivalent to paying an additional $0.27–$0.54/gal.10
- Commercial aircraft emitted 130.8 Mt CO₂e in 2022; emissions vary by aircraft type, trip length, and load.8 A domestic flight emits 0.41 lbs of CO₂e per passenger mile.8,11
- Domestic air travel fuel efficiency (passenger miles/gal) rose 112% since 1990 due to increased occupancy.11
- Rail transportation emitted 35.6 Mt CO₂e in 2022, 2% of U.S. transportation emissions.8
GHG Contribution by Food Type in Average Diet5
Household Energy (See Residential Buildings Factsheet)
- Each kWh generated in the U.S. emits 0.8 lbs of CO₂e.12 Coal emits 2.25 lbs/kWh, petroleum 1.43, and natural gas 0.86.8
- Nuclear, solar, wind, and hydro produce no CO₂ but have upstream emissions from material production and infrastructure (e.g. solar cells, nuclear fuels).13
- Residential electricity use generated 582.2 Mt CO₂e in 2022—9.2% of U.S. total.8 Heating and cooling account for 41% of energy used in U.S. residential buildings in 2024.14
- Electricity used washing clothes emits 2.6 Mt CO₂e/yr.15,16 Switching to cold water for just one load per week can cut household emissions by 70 lbs of CO₂e/yr.17
- Electronics in standby mode account for 5–10% of residential energy use—costing the average U.S. home $100/yr.18
Goods and Services
- The average American buys 53 clothes items a year,19 producing emissions equivalent to driving almost 3000 miles.20,21 The U.S. has the highest fashion carbon footprint at 132 Mt CO₂e/yr—90% of these emissions occur overseas.22
- A piece of furniture emits 9–270 kg CO₂e,23 50-80% is from materials. Buying refurbished cuts emissions by up to 85%.24
- Health care is the most carbon-intensive U.S. household service, emitting 1,692 kg CO₂e per capita in 2018—the highest among industrialized nations. 70% of emissions came from supply chains (pharmaceuticals, medical devices).25
- Using streaming services for 12 hours daily can account for over 50% of an individual’s GHG emissions.26
Food (U.S. Food System Factsheet)
- Agriculture is responsible for 50% of CH4, 66% of N₂O, and 3% of CO₂ emissions.27 Food makes up 10–30% of a household’s emissions, often more in low-income households.8
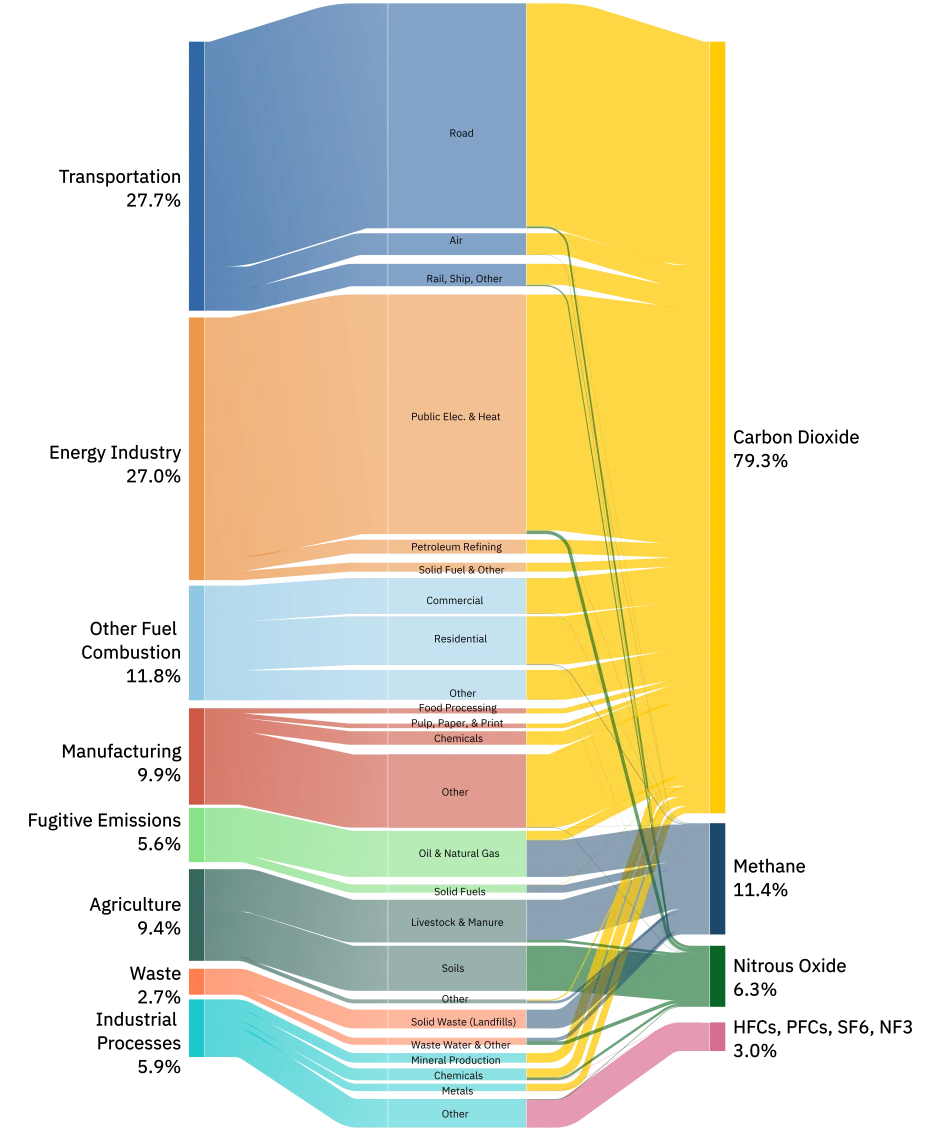
U.S. Greenhouse Gas Emissions, 202133
- Production accounts for 68% of food emissions; 27% comes from retail, restaurants, and wholesale. Transport accounts for just 5%—dietary choices have greater impact.28,62
- Meats like beef produce 36 times more GHG per g of protein than plant-based products;29 most energy from feed is lost, and ruminants like cows emit CH₄ through manure.30 Chicken produces 4.2 g CO₂e/kg, 7 times less than beef.31
- High-emission diets (top 20%) emit 8 times more GHGs than low-emission diets (bottom 20%), accounting for 46% of diet related emissions.5
- Changes in U.S. eating habits cut diet-related GHG emissions by over 35% from 2003–2018.32
Sources of Institutional Emissions
Capital and Infrastructure
- Capital assets cause 75% of emissions for the richest 10%.34
- Embodied carbon from construction materials accounts for 11% of global carbon emissions.35 Every $1B spent on infrastructure generates 1 Mt of embodied carbon.36
- U.S. commercial buildings emit 725 Mt CO₂/yr.37 Data centers alone emit 105 Mt CO₂e/yr,38 projected to double by 2030.39 See Commercial Buildings Factsheet.
- Industrial machinery production accounts for 8% of global CO₂ emissions.40
Military
- Militaries contribute 5.5% of global GHG emissions,41 mostly from supply chains and procurement, not operations.42
- NATO’s military activities in 2023 resulted in 233 Mt CO₂e. The U.S. accounts for ⅔ of these emissions.43
- Rearmament efforts risk breaching the Paris Agreement—below 1.5 °C warming—by 2027. A 1% GDP increase in NATO military spending raises emissions by 200 Mt CO₂e/yr.44
- If NATO meets the 2% GDP military spending goal by 2028, its military’s carbon footprint would be 2 Bt CO₂e/yr—surpassing emissions from all but the top 3 countries (China, India, U.S.)43
Global Emissions and Development
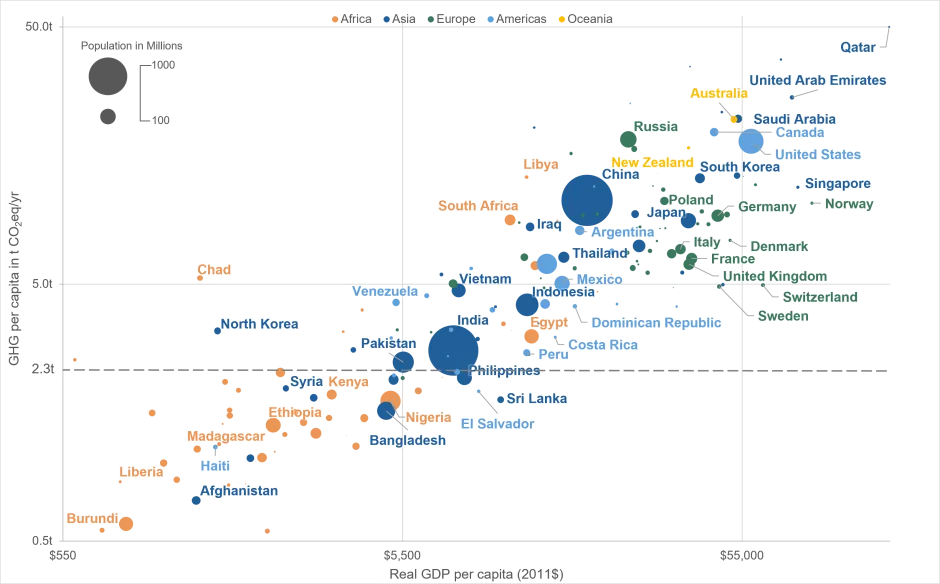
- To stay below 1.5 °C warming, world emissions must fall to 2.3 t CO₂ per capita by 2030.45 This requires countries like the U.S., Canada, and Australia to cut emissions by 80%.2
- The U.S. and Canada emit twice as much per capita as other G7 countries. Countries with similar population to the U.S. (Brazil, Nigeria, Indonesia) emit 2 times less CO₂e/capita.2
- Fossil-exporting Gulf States like Qatar and UAE are outliers, exceeding 30 t CO₂e/capita.2
- The world’s richest 10% emit 24 t CO₂e/capita. The richest 1% make up 15% of global emissions (74 t CO₂e/capita), while the poorest 50% account for 7% (just over 1 t CO₂e/capita).45
- By 2030, the world’s richest 10% will emit 9 times the sustainable per capita level. The richest 1% will emit 30 times the target. The bottom 50% will emit about 1 t CO₂e/capita.45
GHG Emissions per capita by GDP per capita2,46
Solutions and Sustainable Actions
Ways to Reduce Your Carbon Footprint
- Walk, bike, carpool, use transit, or drive best-in-class vehicles.47
- Make your house more energy efficient. Through 2032, get tax credits covering 30%—up to $3,200/yr—for energy-efficient upgrades, plus another 30% for clean energy systems like solar, geothermal, and batteries.48 Continued availability of these credits depends on congressional action.49
- Switching from incandescent to LED bulbs saves $200/yr.50,51
- Unplug devices or switch off power strips when not in use.18
- Purchase secondhand, reusable,52 or low-emission products to reduce waste. See Municipal Solid Waste Factsheet. Many brands now disclose their products’ carbon footprints.53,54
- Reduce meat consumption28 and cut food waste: compost scraps, and donate excess.55 See U.S. Food System Factsheet.
- Reducing snacks, ready-made food, and soft drinks can cut emissions as much as switching to a plant-based diet.56
- Cook at home—restaurant delivery can double emissions.57
- Meal kits may lower GHGs by 33% per meal compared to instore shopping.58
- Solar-reflective roofs can cut home cooling demand by 27%.59 Using reflective roofs on U.S. commercial buildings could offset 22 Mt CO₂e/yr,60 equal to shutting 6 coal plants/yr.61
Carbon Footprint Calculators
Estimate your personal or household greenhouse gas emissions and explore the impact of different techniques to lower those emissions:
Center for Sustainable Systems, University of Michigan. 2025. "Carbon Footprint Factsheet." Pub. No. CSS09-05.
References
- The Carbon Trust (2018) Carbon Footprinting.
https://www.carbontrust.com/resources/carbon-footprinting-guide
- EDGAR (2024) GHG emissions of all world countries 2024
https://edgar.jrc.ec.europa.eu/report_2024?vis=co2pop#emissions_table
- Jones C., Kammen D. (2011) "Quantifying Carbon Footprint Reduction Opportunities for U.S. Households and Communities."
https://pubs.acs.org/doi/pdf/10.1021/es102221h
- Song, K., et al. (2019). Scale, distribution and variations of global greenhouse gas emissions driven by US households.
https://www.sciencedirect.com/science/article/pii/S0160412019315752?via%3Dihub#bb0095
5. Heller, M.C., et al. (2018). Greenhouse gas emissions and energy use associated with production of individual self-selected US diets. Environmental Research Letters, 13(4), 044004.
https://iopscience.iop.org/article/10.1088/1748-9326/aab0ac
6. U.S. EPA (2024) The 2024 EPA Automotive Trends Report: Greenhouse Gas Emissions, Fuel Economy, and Technology since 1975.
https://www.epa.gov/automotive-trends
7. Pero, F. et al. (2018) Life Cycle Assessment in the automotive sector: a comparative case study of Internal Combustion Engine and electric car
https://www.sciencedirect.com/science/article/pii/S2452321618301690
8. U.S. Environmental Protection Agency (EPA) (2024) Inventory of U.S. Greenhouse Gas Emissions and Sinks: 1990–2022.
https://www.epa.gov/ghgemissions/inventory-us-greenhouse-gas-emissions-and-sinks-1990-2021
9. U.S. Department of Energy (DOE), Oak Ridge National Lab (2022) Transportation Energy Data Book: Edition 40.
10. U.S. DOE, Office of Energy Efficiency and Renewable Energy (EERE) (2024) “Driving More Efficiently."
https://www.energy.gov/energysaver/driving-more-efficiently
11. U.S. Department of Transportation Bureau of Transportation Statistics (2023) National Transportation Statistics 2023.
https://www.bts.gov/content/energy-intensity-certificated-air-carriers-all-services
12. U.S. EPA (2025) “Emissions & Generation Resource Integrated Database (eGRID) 2023.”
https://www.epa.gov/egrid/download-data
13. U.S. Energy Information Administration (EIA) (2023) Electric Power Monthly with Data from January 2023. Electric Power Monthly - U.S. Energy Information Administration (EIA)
14. U.S. EIA (2025) Annual Energy Outlook 2025.
https://www.eia.gov/outlooks/aeo/tables_ref.php
15. U.S. EIA (2023) Residential Energy Consumption Survey 2020.
https://www.eia.gov/consumption/residential/data/2020/index.php?view=consumption
16. U.S. EPA (2022) Emissions Factors for Greenhouse Gas Inventories
https://www.epa.gov/system/files/documents/2022-04/ghg_emission_factors_hub.pdf
17. Mars C. (2016) Benefits of Using Cold Water for Everyday Laundry in the U.S.
18. U.S. DOE (2012) “3 Easy Tips to Reduce Your Standby Power Loads.”
http://energy.gov/energysaver/articles/3-easy-tips-reduce-your-standby-power-loads
19. FashionUnited. Global Fashion Industry Statistics. Accessed May 2025.
https://fashionunited.com/statistics/global-fashion-industry-statistics
20. Carbonfact. How Much CO₂ Does a T-Shirt Emit? Accessed May 2025.
https://www.carbonfact.com/blog/tshirt
21. World Bank. The Price Tag of Fashion: What’s the Cost to the Environment? September 23, 2019. Accessed May
2025.
https://www.worldbank.org/en/news/feature/2019/09/23/costo-moda-medio-ambiente
22. 54. Zhikun, L. et al. (2024) The carbon footprint of fast fashion consumption
https://www.sciencedirect.com/science/article/pii/S0048969724016498
23. FIRA (2011) BENCHMARKING CARBON FOOTPRINTS of Furniture Products
https://www.healthyworkstations.com/resources/Environment/FIRA.CarbonFootprint.pdf
24. COGGIN (2025) The carbon footprint of office furniture
https://www.coggin-sos.co.uk/the-carbon-footprint-of-office-furniture
25. Eckelman, M. J., et. al (2020). “Health Care Pollution and Public Health Damage in the United States: An Update.” Health Affairs 39, no. 12: 2071–2079.
https://doi.org/10.1377/hlthaff.2020.01247
26. GreenSWRM. The Carbon Footprint of Your Entertainment, Part I: Movies, Television, the Stage. Accessed May 2025.
https://greenswrm.com/the-carbon-footprint-of-your-entertainment-part-i-movies-television-the-stage/
27. Ivanovich, et. al, (2023) Future warming from global food consumption
28. Ritchie H. (2020) - “You want to reduce the carbon footprint of your food? Focus on what you eat, not whether your food is local” Published online at OurWorldinData.org. Accessed May 23 2025
https://ourworldindata.org/food-choice-vs-eating-local
29. Poore, J., and Nemeck, T. (2019) Reducing Food's Environmental Impacts through Producers and Consumers. Science, 360(6392), 987–992.
https://doi.org/10.1126/science.aaq0216
30. Weber, C. and H. Matthews (2008) "Food miles and the Relative Climate Impacts of Food Choices in the United States." Environmental Science & Technology, 42(10): 3508-3513.
http://pubs.acs.org/doi/pdf/10.1021/es702969f
31. Heller, M., et al. (2020). Implications of Future US Diet Scenarios on Greenhouse Gas Emissions.
http://css.umich.edu/sites/default/files/publication/CSS20-01.pdf
32. Bassi C., et al, (2022) Declining greenhouse gas emissions in the US diet (2003–2018)
https://www.sciencedirect.com/science/article/pii/S0959652622010861
33. UNCC (2023) United States. 2023 Common Reporting Format (CRF) Table
https://unfccc.int/documents/627772
34. Chancel, L. and Rehm, Y. (2023) The Carbon Footprint of Capital
35. WorldGBC (2019) Bringing Embodied Carbon Upfront
https://worldgbc.org/climate-action/embodied-carbon/
36. KPMG (2023) Embodied Carbon Management for Global Infrastructure
37. EIA (2025) Annual Energy Outlook
https://www.eia.gov/outlooks/aeo/tables_ref.php
38. Guidi, G. et al. (2024) Environmental Burden of United States Data Centers
https://arxiv.org/pdf/2411.09786
39. S&P Global Ratings (2024) Data Centers' Rapid Growth Will Test U.S. Tech Sector’s Decarbonization Ambitions. Accessed May 2025.
40. Jiang, M., et al. (2023) Material and Carbon Footprints of Machinery Capital. Environmental Science & Technology 57, no. 50: 21124–21135.
https://doi.org/10.1021/acs.est.3c06180
41. CEOBS (2022) Estimating Global MIlitary GHG Emissions
https://ceobs.org/new-estimate-global-military-is-responsible-for-more-emissions-than-russia/
42. The Military Emissions Gap (2025) The Problem
https://militaryemissions.org/problem/
43. Transnational Institute (TNI). (2023) Climate in the Crosshairs: How the Arms Industry is Profiting from Climate Disaster.
https://www.tni.org/en/publication/climate-in-the-crosshairs
44. CEOBS (2025) How increasing global military expenditure threatens SDG 13 on Climate action
https://ceobs.org/how-increasing-global-military-expenditure-threatens-sdg-13-on-climate-action/
45. IEEP and SEI. (2021) Carbon Inequality in 2030: Per Capita Consumption Emissions and the 1.5°C Goal.
46. Maddison Project Database (MPD) 2023
https://www.rug.nl/ggdc/historicaldevelopment/maddison/releases/maddison-project-database-2023
47. United Nations. (2025). ActNow: Transport. United Nations. Accessed May 23 2025
https://www.un.org/en/actnow/transport
48. US Energy Star (2024) Federal Tax Credits for Energy Efficiency
https://www.energystar.gov/about/federal-tax-credits#homeowners
49. Daly, M., St. John, A., & Brown, M. (2025, May 23). Tax bill passed by House Republicans would gut Biden-era clean energy tax credits. AP News.
50. Liu, L., Keoleian, G. A., & Saitou, K. (2017). Replacement policy of residential lighting optimized for cost, energy, and greenhouse gas emissions. Environmental Research Letters, 12(11), 114034.
https://iopscience.iop.org/article/10.1088/1748-9326/aa9447/pdf
51. Department of Energy (2023) Energy Saving Hub. Energy Savings Hub | Department of Energy
52. United States Environmental Protection Agency. Reducing waste: What you can do. Accessed May 23 2025
https://www.epa.gov/recycle/reducing-waste-what-you-can-do
53. Clever Carbon. Find out the carbon footprint of common items. Accessed May 23, 2025
https://clevercarbon.io/carbon-footprint-of-common-items
54. Meinrenken C., et al. (2022) The Carbon Catalogue, carbon footprints of 866 commercial products from 8 industry sectors and 5 continents. Scientific Data, 9, Article 87.
https://www.nature.com/articles/s41597-022-01178-9
55. US EPA (2024) Reducing and Reusing Basics
https://www.epa.gov/recycle/reducing-and-reusing-basics
56. Song L., et al. (2021) Large-Scale Microanalysis of U.S. Household Food Carbon
https://pubs.acs.org/doi/epdf/10.1021/acs.est.1c02658?ref=article_openPDF
57. Matsuyuki, M., et al. (2024). Assessment of the sustainability of online food delivery from the perspective of CO₂ emissions and transport intensity: A case study in Jakarta. Transportation Research Interdisciplinary Perspectives, 27, 101200.
https://doi.org/10.1016/j.trip.2024.101200
58. Miller, S. A. et al. (2019). Comparison of life cycle environmental impacts from meal kits and grocery store meals. Resources, Conservation and Recycling, 147, 189–200.
https://doi.org/10.1016/j.resconrec.2019.04.008
59. U.S. Environmental Protection Agency. (2025). Using cool roofs to reduce heat islands.
https://www.epa.gov/heatislands/using-cool-roofs-reduce-heat-islands?utm_source=chatgpt.com#6
60. Levinson, R. (2012) The Case for Cool Roofs. Lawrence Berkeley National Laboratory, Heat Island Group.
https://heatisland.lbl.gov/publications/case-cool-roofs
61. U.S. EPA (2025) “Greenhouse Gas Equivalencies Calculator.”
https://www.epa.gov/energy/greenhouse-gas-equivalencies-calculator
62. Boehm R., et al. (2018) "A Comprehensive Life Cycle Assessment of Greenhouse Gas Emissions from U.S. Household Food Choices." https://www.sciencedirect.com/science/article/pii/S0306919217310552
63. University of California, Berkeley. CoolClimate Calculator. Accessed April 2025.